Gold Cycle Update: U.S. Stocks Forming Key Low


 As mentioned in a prior article, the last correction of significance was due to play out with our 72-day time cycle, which ended up confirming a very early low - doing so with the late-February tag of 2844.10 (April, 2025 contract). With that, this wave is now seen as pushing higher overall into May, but with an in-between dip currently in force, coming from the smaller-degree cycles.
Gold, Short-Term
For the short-term picture, the smaller 10 and 20-day cycles are seen as heading slightly lower, with the next smaller-degree trough expected to come from these two waves. Shown below is the smaller 10-day component:
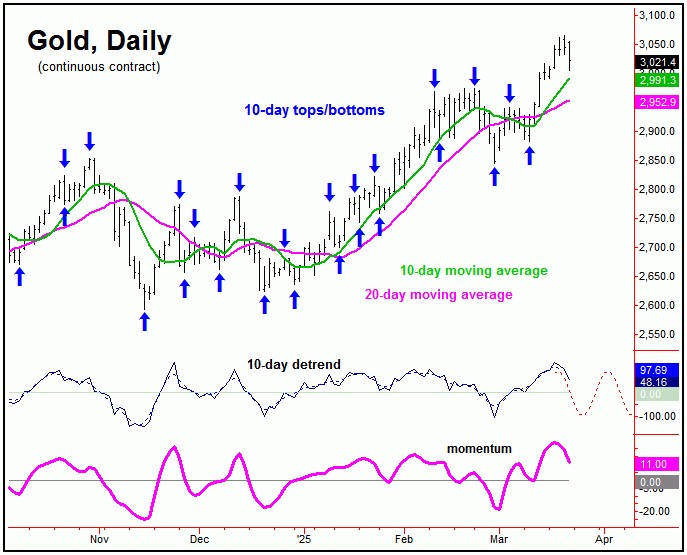
In terms of price, there is the potential for a drop back to the 10 and 20-day moving averages in the coming days, as these waves bottom out - with the lower 20-day average seen as key short-term support.
Gold's 72-Day Cycle
Stepping back, the upward phase of our larger 72-day cycle is deemed to be in force, ideally pushing higher into May, plus or minus. Shown below is that 72-day wave:
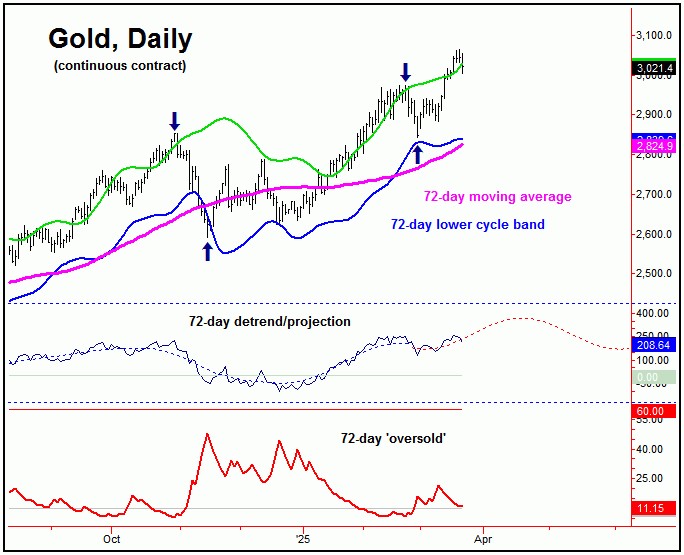
If the upward phase of this 72-day cycle is to remain intact, then the next short-term decline with the smaller 10 and 20-day cycles would be favored to end up as countertrend, holding above the 2882.50 figure (April, 2025 contract) - their most recent bottom.
Stepping back then, a countertrend dip with the 10 and 20-day waves would be favored to give way to higher highs on the next swing up. In terms of price, the 3100 figure (April, 2025 contract) would be an ideal magnet to the next rally phase of these waves, with the same acting as a key resistance level, plus or minus.
Going further, adding weight to the idea of 3100 as a potential magnet - and a key resistance level - is the intersection of the extrapolated 34 and 72-day upper cycle channels, shown on the next chart:
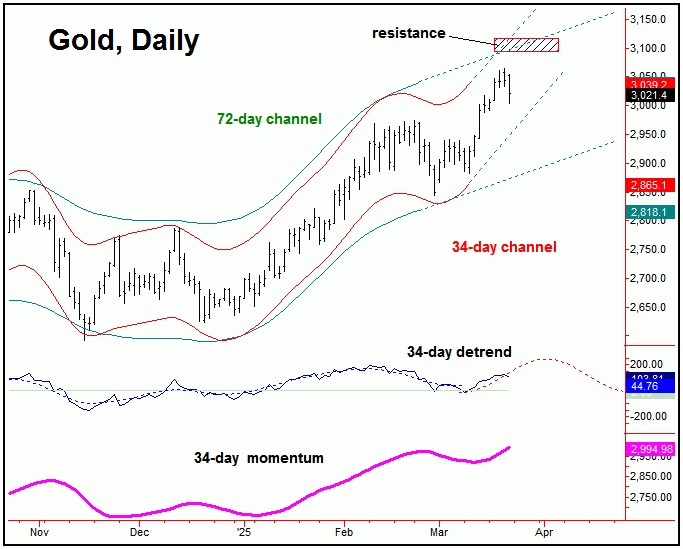
Adding to the notes above, support to the current short-term downward phase with the 10 and 20-day cycles would be at or near the rising lower 34-day cycle channel - which is currently around the 2960's - not too far from the aforementioned 20-day moving average for Gold.
Stepping back further, as mentioned in our Gold Wave Trader report, a statistical analysis of the bigger 72-day cycle suggests the potential for an eventual push up to 3185-3240 into May, though an in-between correction could come from that 3100 figure.
The 310-Day Cycle
Above the 72-day cycle in Gold, there is a larger 310-day wave, which sets the direction for the mid-term trend:
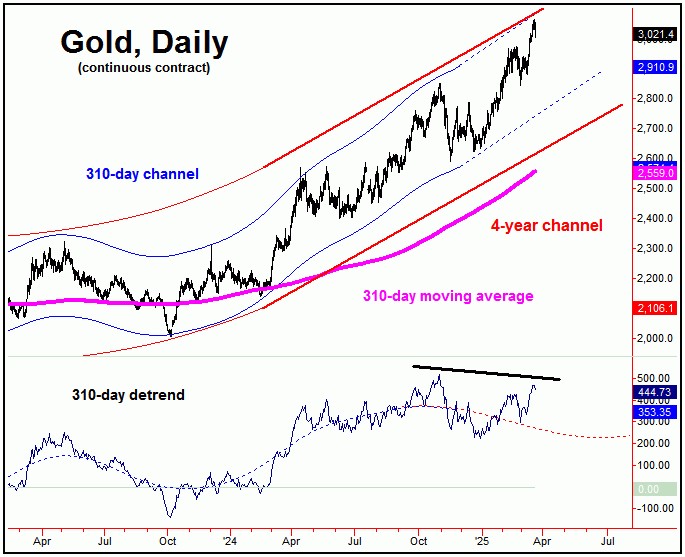
With the January break to higher highs for the bigger swing (i.e., taking out the October, 2024 peak), the upward phase of this 310-day wave is seen as extended, though does have some potential to peak with the current upward phase of the smaller 72-day cycle.
In terms of price, we do have a key number with this 310-day cycle, which is the 2844.10 swing low from February. This number needs to hold any near-term downside going forward, in order to keep the 310-day cycle's extended upward phase intact.
U.S. Stock Market, Mid-Term
For the U.S. stock market, as mentioned in some of my prior articles the 180 and 360-day time cycles were seen as pushing higher into the late-2024 to early-2025 region - before topping, and giving way to a sharp decline into this Spring.
Here again is the smaller 180-day cycle on the S&P 500:
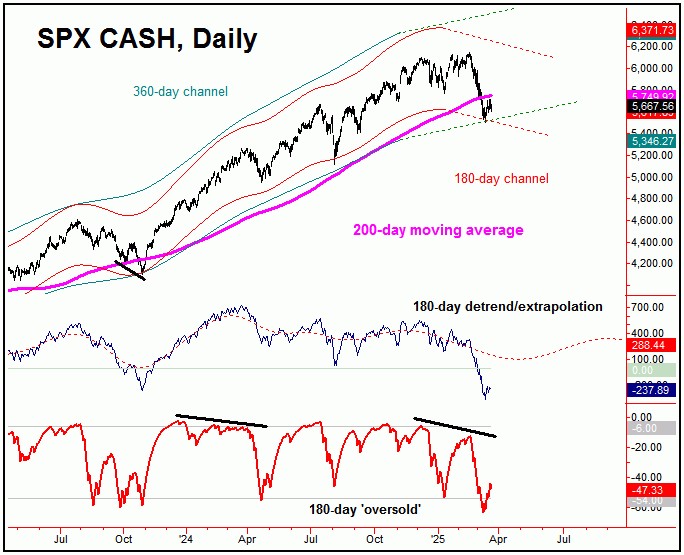
In terms of time, the trough for our 180-day wave has been projected for April of this year, but with a larger plus or minus variance in either direction - due to the size of the 180 and 360-day waves.
As mentioned in prior articles, a normal correction with this 180-day wave in U.S. stocks would take prices back to the rising 200-day moving average - which has obviously been met with the sharp decline off the mid-February peak. Since we are now below this 200-day moving average, it will also act as a first level of resistance.
With the above said and noted, the next low (and rally) of significance is expected to come from the 180 and 360-day waves in U.S. stocks, which are projected to bottom this Spring (i.e., April, plus or minus). Shown below is a combination forecast, from these 180 and 360-day cycles:
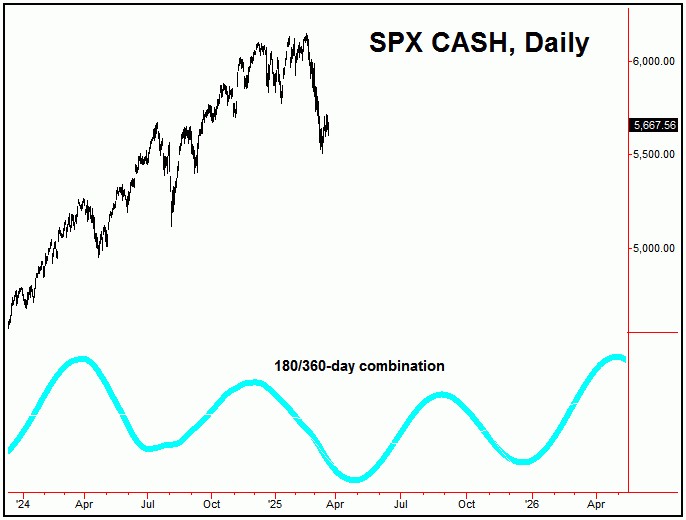
From a statistical inference with our smaller 180-day wave, there is the potential for a rally of some 17-20% off the next 180 and 360-day low, playing out into later this year. However, this will depend on whether the current correction phase of these waves ends up as countertrend, holding above the 5119.26 SPX CASH figure - the August, 2024 low - the last trough for our 180-day cycle.
In terms of price, it is too early to confirm an upside reversal point for these 180 and 360-day cycles, though one should ideally develop at some point. If triggered, it will be noted in our Market Turns report, which tracks the U.S. stock market; stay tuned.
Jim Curry
The Gold Wave Trader
Market Turns Advisory
http://goldwavetrader.com/
http://cyclewave.homestead.com/
*********
More from Gold-Eagle


