Gold Stocks: An Epic Wave Higher?


US 10 Year Bond Yield:
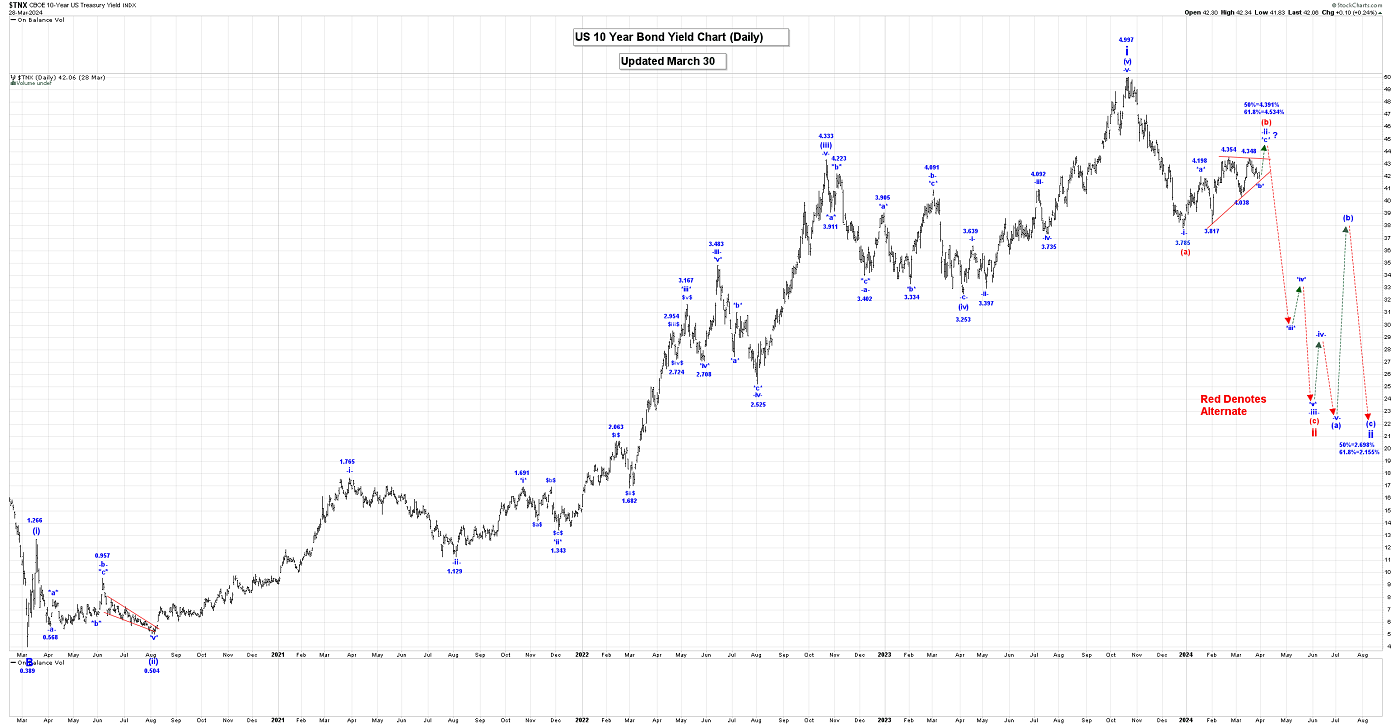
Analysis:
The US 10-year Bond Yield has completed wave i at the 5.021% high and we are now correcting that 5-wave impulsive sequence within wave ii, which has the following retracement levels:
50% = 2.698%;
61.8% = 2.155%.
We are currently assuming that wave ii will be a simple 3 wave corrective pattern as shown on our Daily US 10 Year Bond Yield Chart. If this is the corrective pattern that wave ii is following then we are now assuming that all of wave -i- of (a), ended at 3.785% and it now looks like wave -ii- is still underway and we now think that the wave -ii- correction includes a bullish triangle as shown on our Daily 10 Year US Bond Yield Chart.
Also, US rates are not confirming the dollar’s latest high, which is a bullish sign for gold!
Our retracement levels for all of wave -ii- are:
50% = 4.391%.
61.8% = 4.534%.
We will provide our initial projected endpoint for wave -iii- when we believe that all of wave -ii- is complete.
Our plan is to stay short to capture all of the wave (a) or the ii drop!
Trading Recommendation: Short, risking to 5.050%.
Active Positions: Short risking to 5.050%!
Gold:
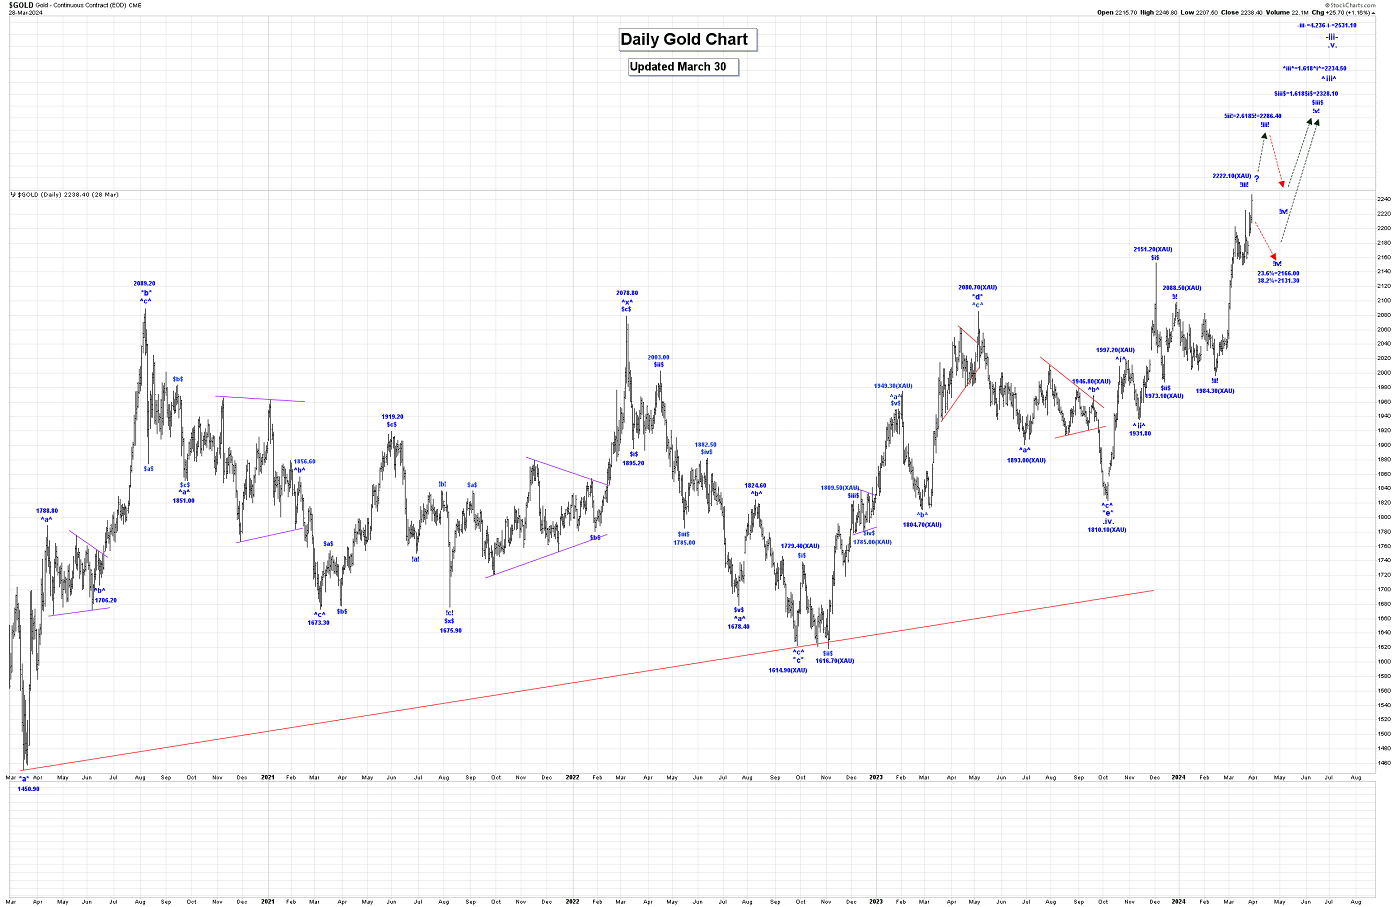
Analysis:
We continue to rally in wave .v.. Within wave .v., we completed wave ^i^ of *i* at the 1997.20 high and all of wave ^ii^ at 1931.80. If that is the case, then we are rallying in wave ^iii^, which has an initial projected endpoint of: ^iii^ = 1.618^i^ = 2234.50!
It looks like wave ^iii^ is subdividing with wave $i$ ending at 2151.20 and wave $ii$ at the 1973.10 low. We are also rallying in a subdividing wave $iii$ with wave !i! ending at 2088.50 and wave !ii! at 1984.30.
Wave !iii! may now be extending to our second projected endpoint of: !iii! -= 2.618!i! = 2286.40.
We are still short of our next projected endpoint for wave !iii!, so we should expect higher prices in the days ahead.
Should wave !iii! extend further our next projected endpoint for wave !iii! is: !iii! = 4.236!i! = 2473.10.
Our current projected target for the end of wave -iii- is:
-iii- = 4.236-i- = 2531.10!
Trading Recommendation: Long gold. Use puts as stops.
Active Positions: Long gold, with puts as stops!
CDNX:
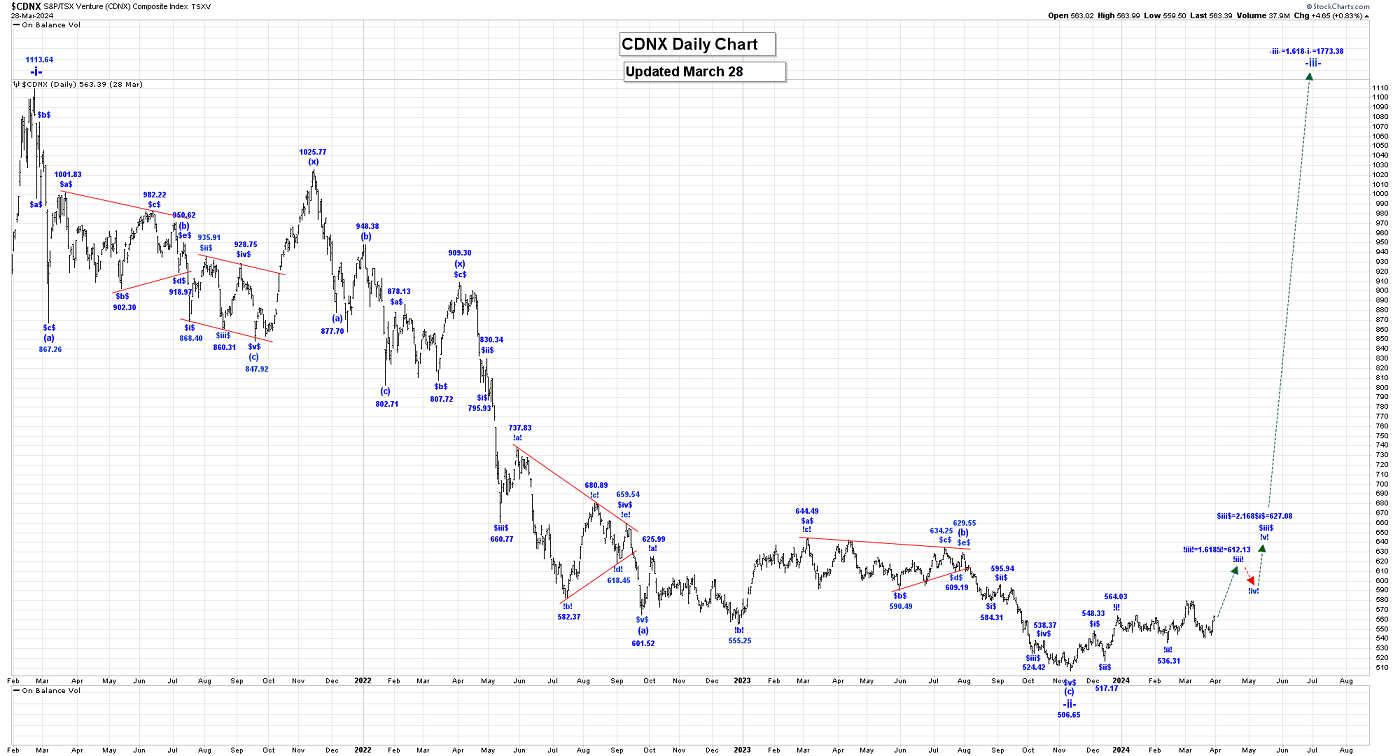
Analysis:
Our long wave -ii- correction is a triple three wave pattern, is complete at the 506.65 low. We are now rallying in wave -iii-, which has an initial projected endpoint of:
-iii- = 1.618-i- = 1773.38.
Within wave -iii-, we are rallying in wave (i) and within wave (i), wave $i$ ended at 548.33 and wave $ii$ at 517.17. We are also rallying in wave $iii$ which has a projected endpoint of:
$iii$ = 2.618$i$ = 627.08.
On the Intraday Chart the rally from 536.31 to 579.67 has a completed impulsive structure and the drop from 579.67 to 541.20 is corrective looking, which has retraced a little over 78.6% of the initial impulsive move higher.
We believe that after this corrective drop ends, perhaps at the 541.20 low, we should move higher again, as we continue to work on our wave !iii! rally. We also have a key daily reversal on the chart.
Trading Recommendation: Go Long the GDXJ as a long-term hold.
Active Positions: Heavily long the GDXJ and key juniors on the CDNX, as a long-term hold!
GDX:
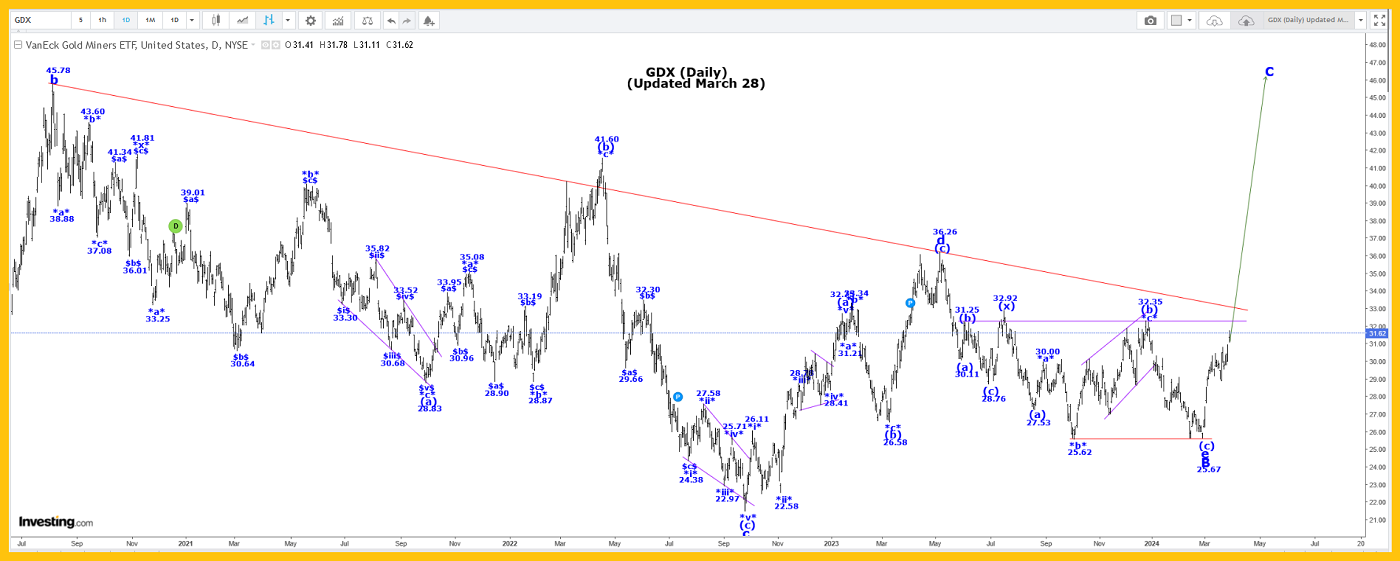
Analysis:
It appears that our wave B bullish triangle is complete at the 25.67 low.
If that is the case, then we are starting to rally in wave C. We provided our projections for the end of wave C to subscribers in our last Weekly Post.
Within wave C we are still moving higher in wave $i$ of -i- of (i) of i.
We suspect that the completion of wave $i$ should occur at the major resistance level around the 33.00 level, which could match the end of wave !iii! in gold.
After wave $i$ ends we expect a wave $ii$ correction that retraces between 50 to 61.8% of the entire wave $i$ rally.
On the Intraday Chart we are watching a potential bullish tringle formation, which appears to be nearing completion.
If this observation is correct, then we should expect a sharp thrust higher very soon.
The Gold Indices/Gold ratio is approaching all-time lows, while gold is breaking to all-time new highs! We believe the upcoming gold stock/indices rally will be of “biblical scale”… and is now getting underway!
Free Offer For Gold-Eagle Readers: Please send me an Email to [email protected] and I’ll send you our free “HUI & Kinross: A Golden Wave Higher!” report. We highlight key wave count action for the important HUI (gold stocks) index and for undervalued bellwether Kinross too!
Thank-you!
Captain Ewave & Crew
Email: [email protected]
Website: www.captainewave.com
********
More from Gold-Eagle


