Our Current Position on the Gold Sector


Last week we covered the GLD, and this week, we will cover the gold stocks ETFs.
First, a simple analysis

Commercials have further decreased their net short to 80k this week, the lowest number in over a year. While this number is still higher than previous major bottoms, but with gold at $200 higher now, a significant rally can begin at this level.
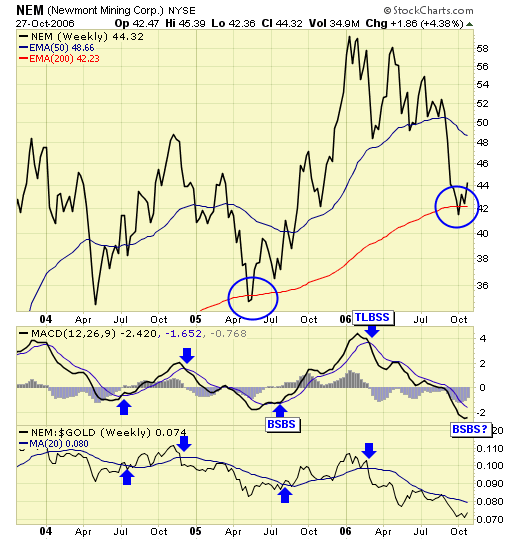
Newmont is to the gold sector what Intel is to the tech sector. It is heavily weighted within the $HUI and $XAU, and therefore, its performance greatly affects the entire gold sector. A positive development these past two weeks is the fact that NEM has found support at the weekly 200ema again. Last time it did that was May 2005, which triggered one of the best rallies in the gold sector and lasted into May 2006, the best rally since Dec 2003 for the gold sector. Much work and time is still needed to confirm the weekly BSBS, and the first thing NEM must do is to begin outperforming the price of gold. No substantial rally has occurred for the entire gold sector until this happens since this new gold bull market started in late 2000.
But in the meantime….
The signals and set ups

GDX - our trading model has already given us a buy signal on 10/13, with US traders buying the GDX at $35.43, with stop at $33.71. That original risk of 5% has now dropped to zero as we are moving stops to breakeven, or we will exit upon a break of support, which is currently at the $36 area. Therefore, we may make a small profit even if we were wrong or early.
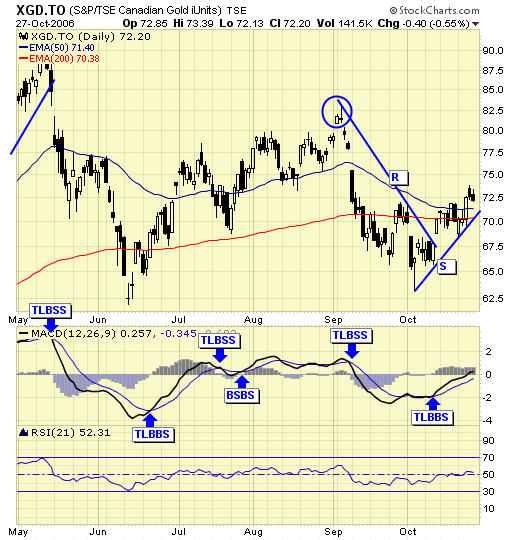
XGD.TO - Canadian traders bought XGD at $70.29 with stop at $68.44. Original risk was under 3% and has now dropped to zero also, as we are moving stops to breakeven, or we will exit on a break of support which currently lies near $71.
Summary
The condition has changed dramatically in the past two weeks for the gold sector, and it now favors buyers over sellers. Ingredients are in place for a substantial rally, although the beginning of each major advance is usually dominated by nervous longs which could result in volatility for the short term. As you can see from the NEM chart, much work and time is still needed before a major buy signal can be confirmed, but in the meantime, our trading models allow us to be fully positioned in the gold sector with relatively low risk exposure. We have no idea what the outcome will be, as we do not forecast or predict the future. We follow price action, wait for set up, pull our trigger, and manage our risk. The rest is up to the markets.
Disclosure: these updates are time sensitive, market conditions may have changed by the time you read this. Only paid subscribers receive these buy/sell alerts in real time.
********

Jack Chan is the editor of Simply Profits, established in 2006. Chan bought his first mining stock, Hoko Exploration, in 1979, and has been active in the markets for the past 37 years. Technical analysis has helped him filter out the noise and focus on the when, and leave the why to the fundamental analysts. His proprietary trading models have enabled him to identify the NASDAQ top in 2000, the new gold bull market in 2001, the stock market top in 2007, and the US dollar bottom in 2011.
More from Gold-Eagle


