Searching For A Bottom In The PM Complex


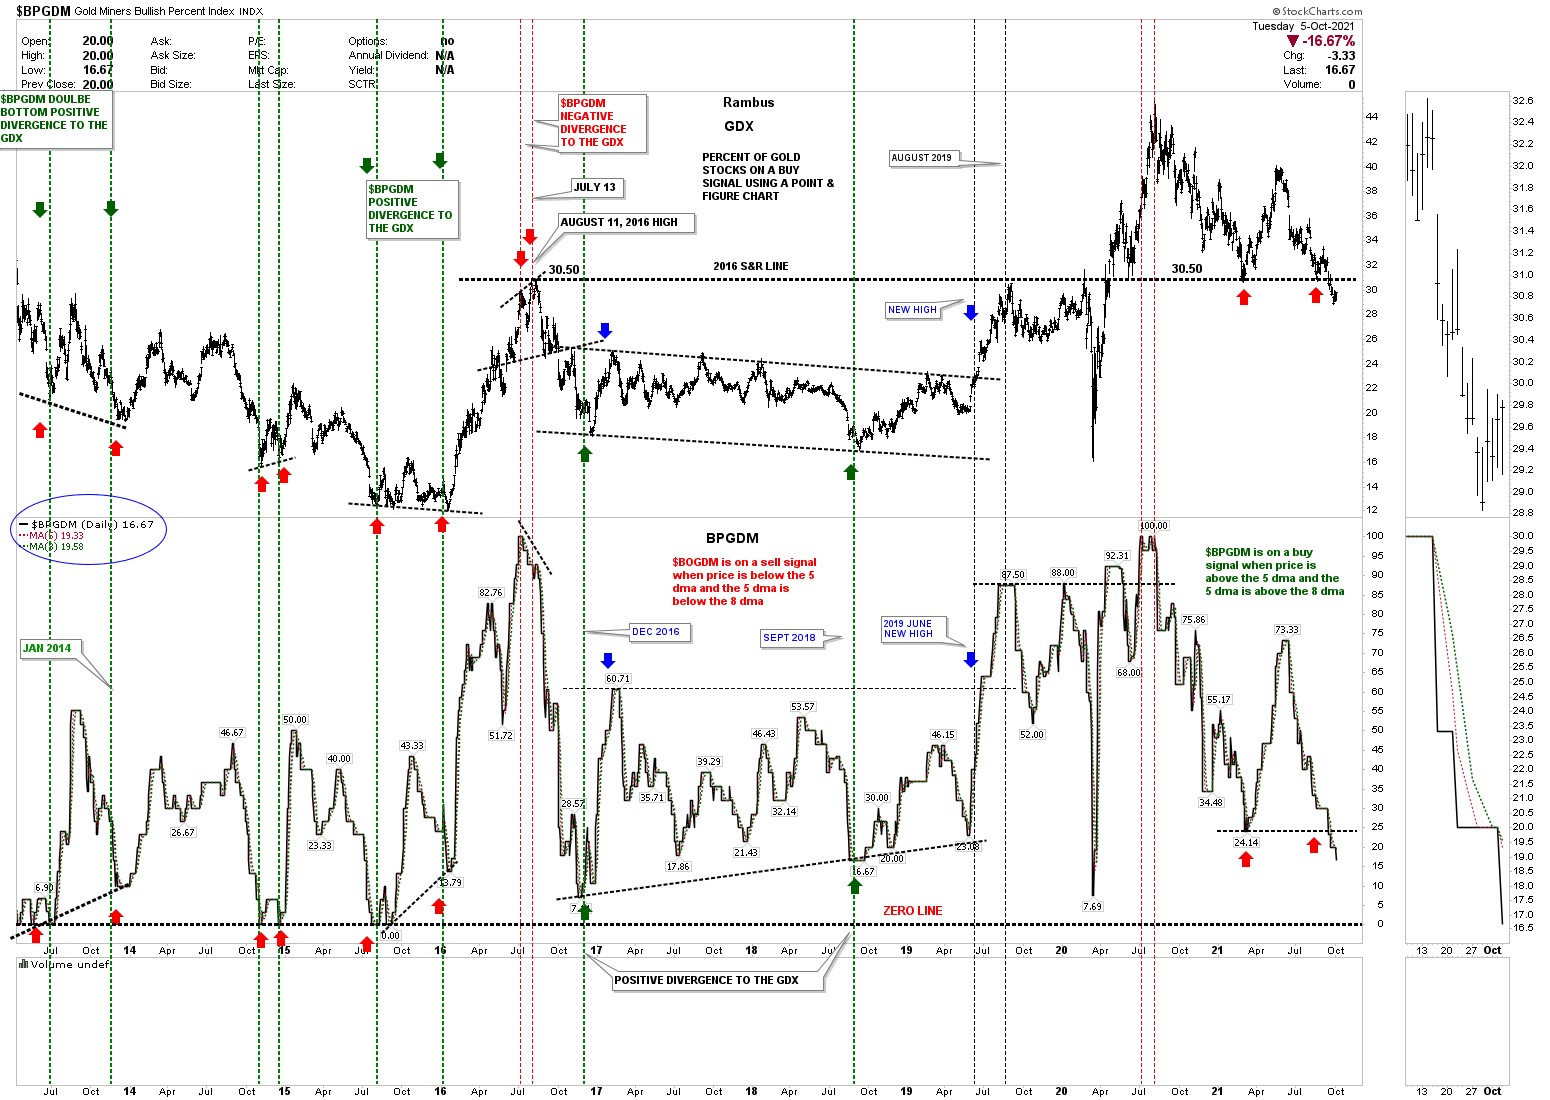
Let’s start with the BPGDM, Gold miners bullish percent chart which has just made a lower low along with the GDX on top. If you recall I was looking for some kind of divergence between the 2 which hasn’t happened yet red arrows on right side of the chart. There is no doubt that the BPGDM is trading down toward the low end of its range between 100 on top and zero on the bottom. It would be nice to see the GDX on top trade back above the 2016 horizontal S&R line at 30.50.
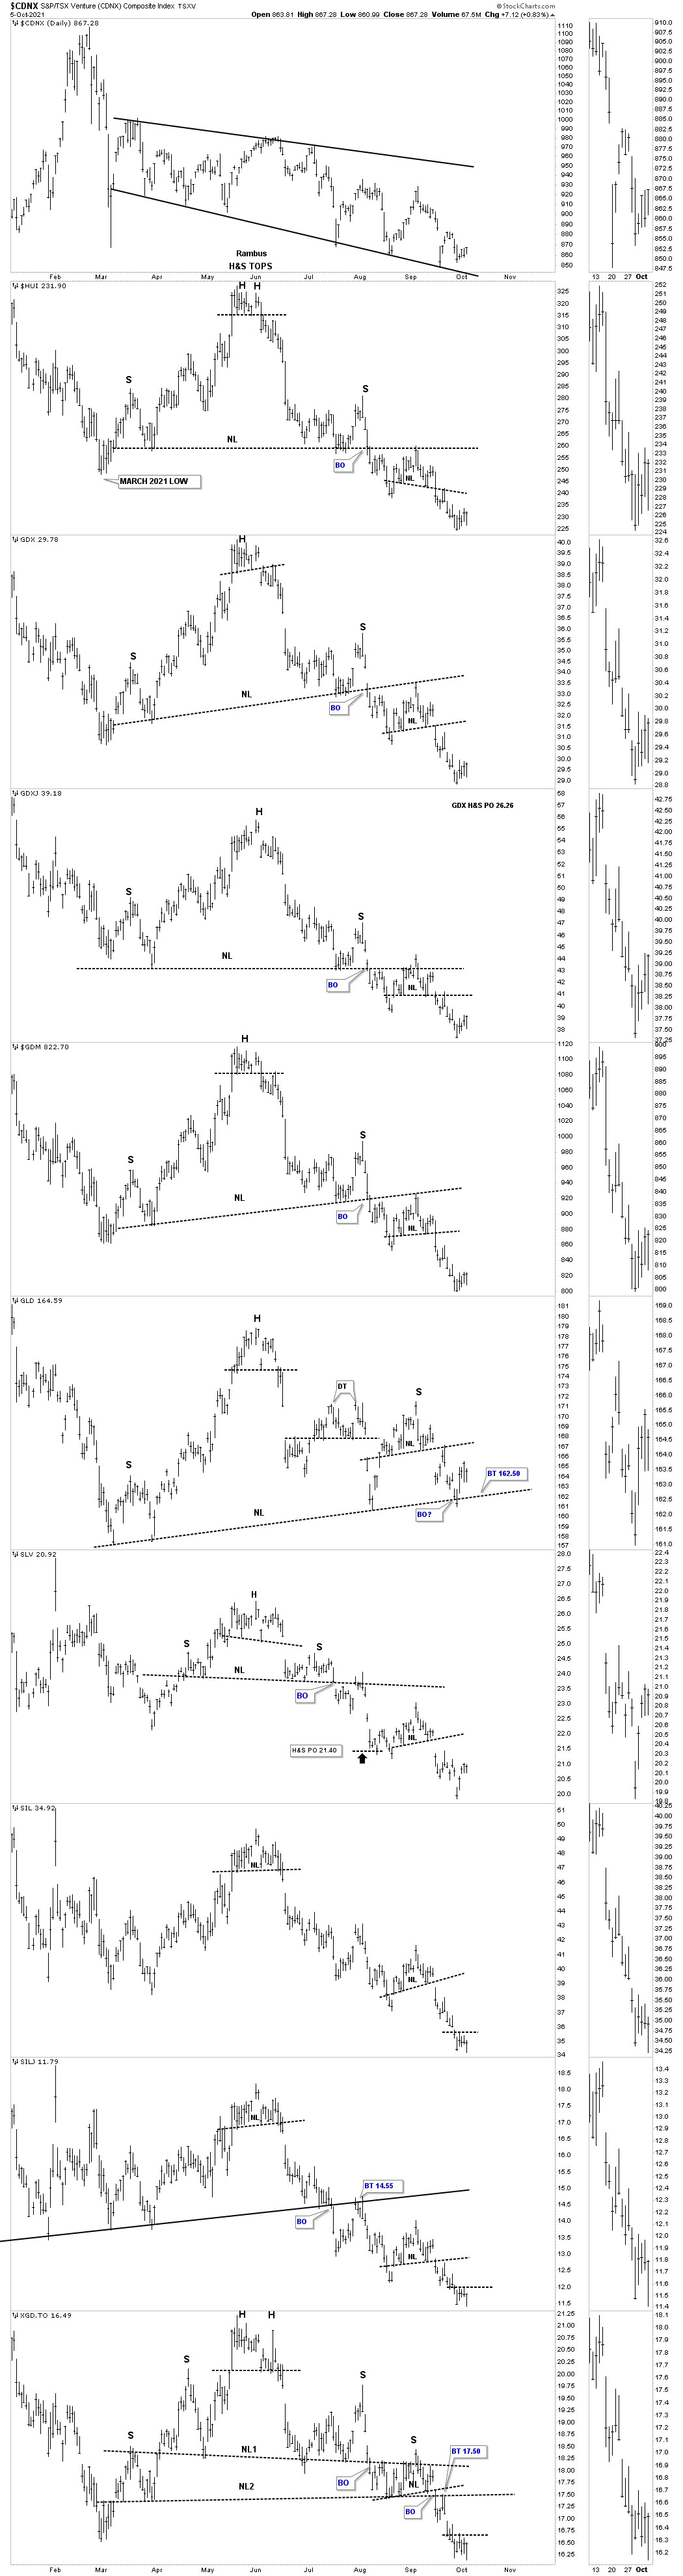
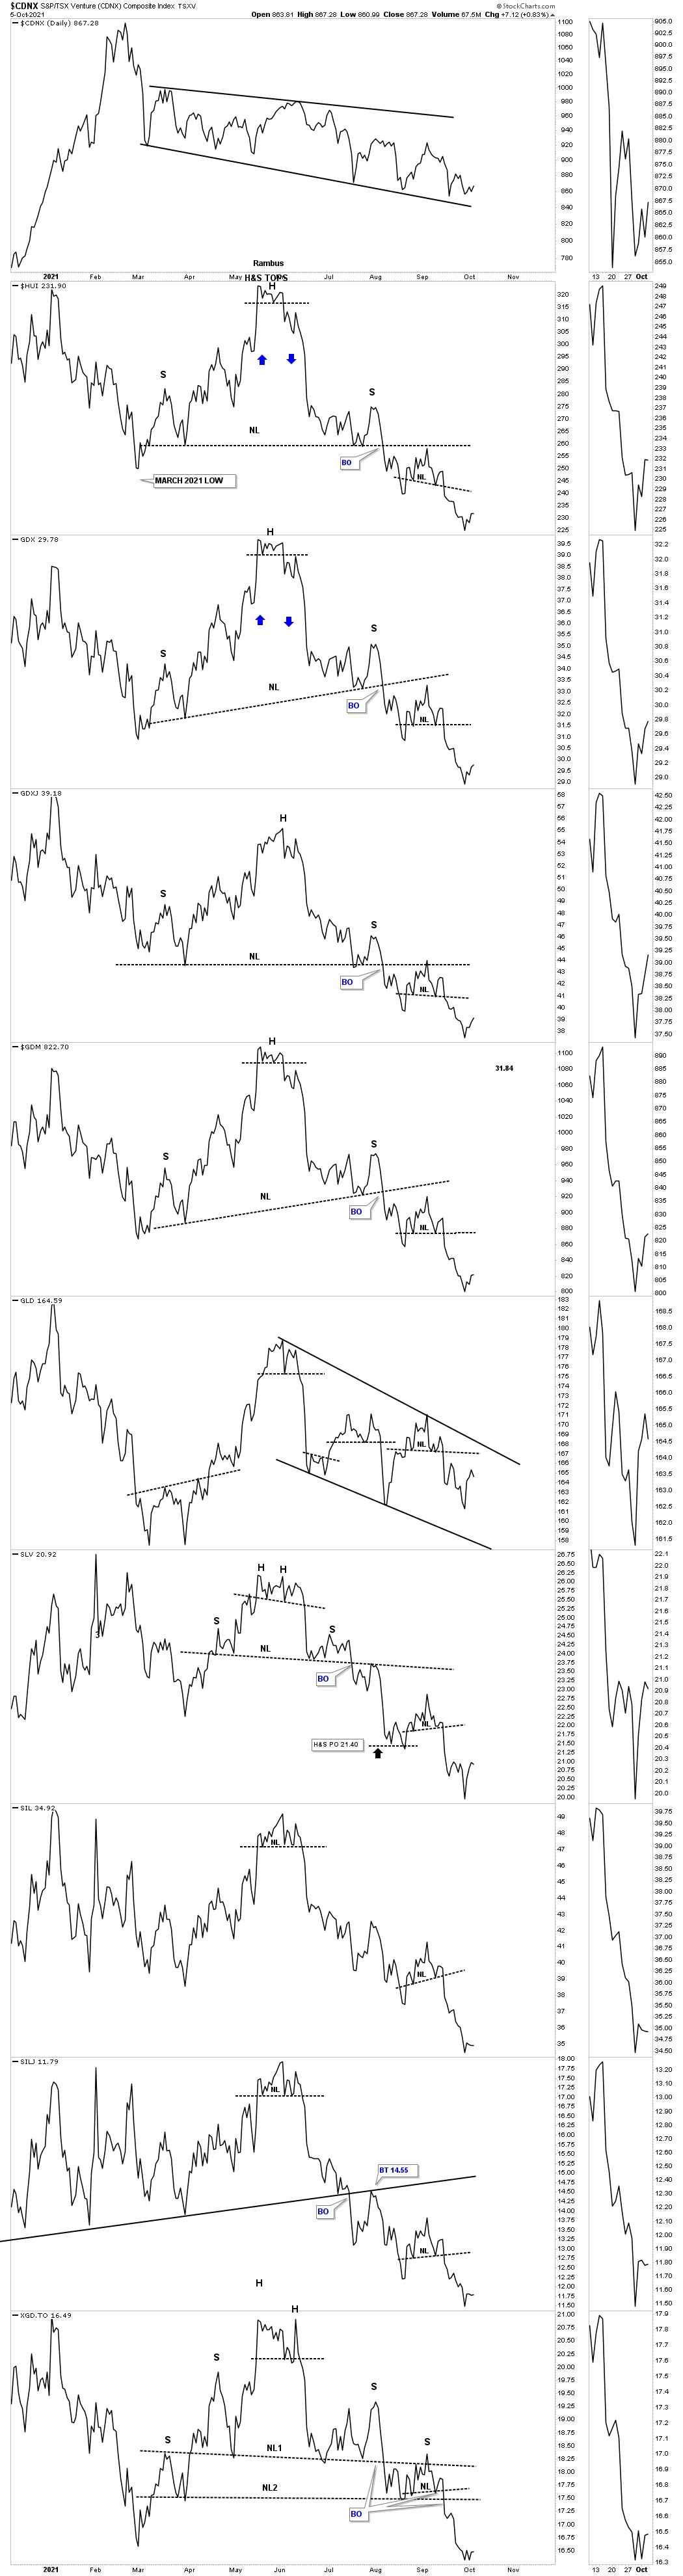
Next is the daily combo chart showing the June H&S top with the small H&S consolidation pattern as the backtest to the neckline. Since the low was hit last week it is time to look for some type of small reversal pattern to reverse the recent move down. The XGD, SILJ, SIL and XGD,TO show a potential small double bottom forming if the price action can take out the double bottom trendline. See thumbnail on right sidebar.
Many times a daily line chart can show a double bottom or H&S bottom better than a bar chart. Looking at GLD and SLV you can see a possible H&S bottom forming with the possible right shoulder under construction.
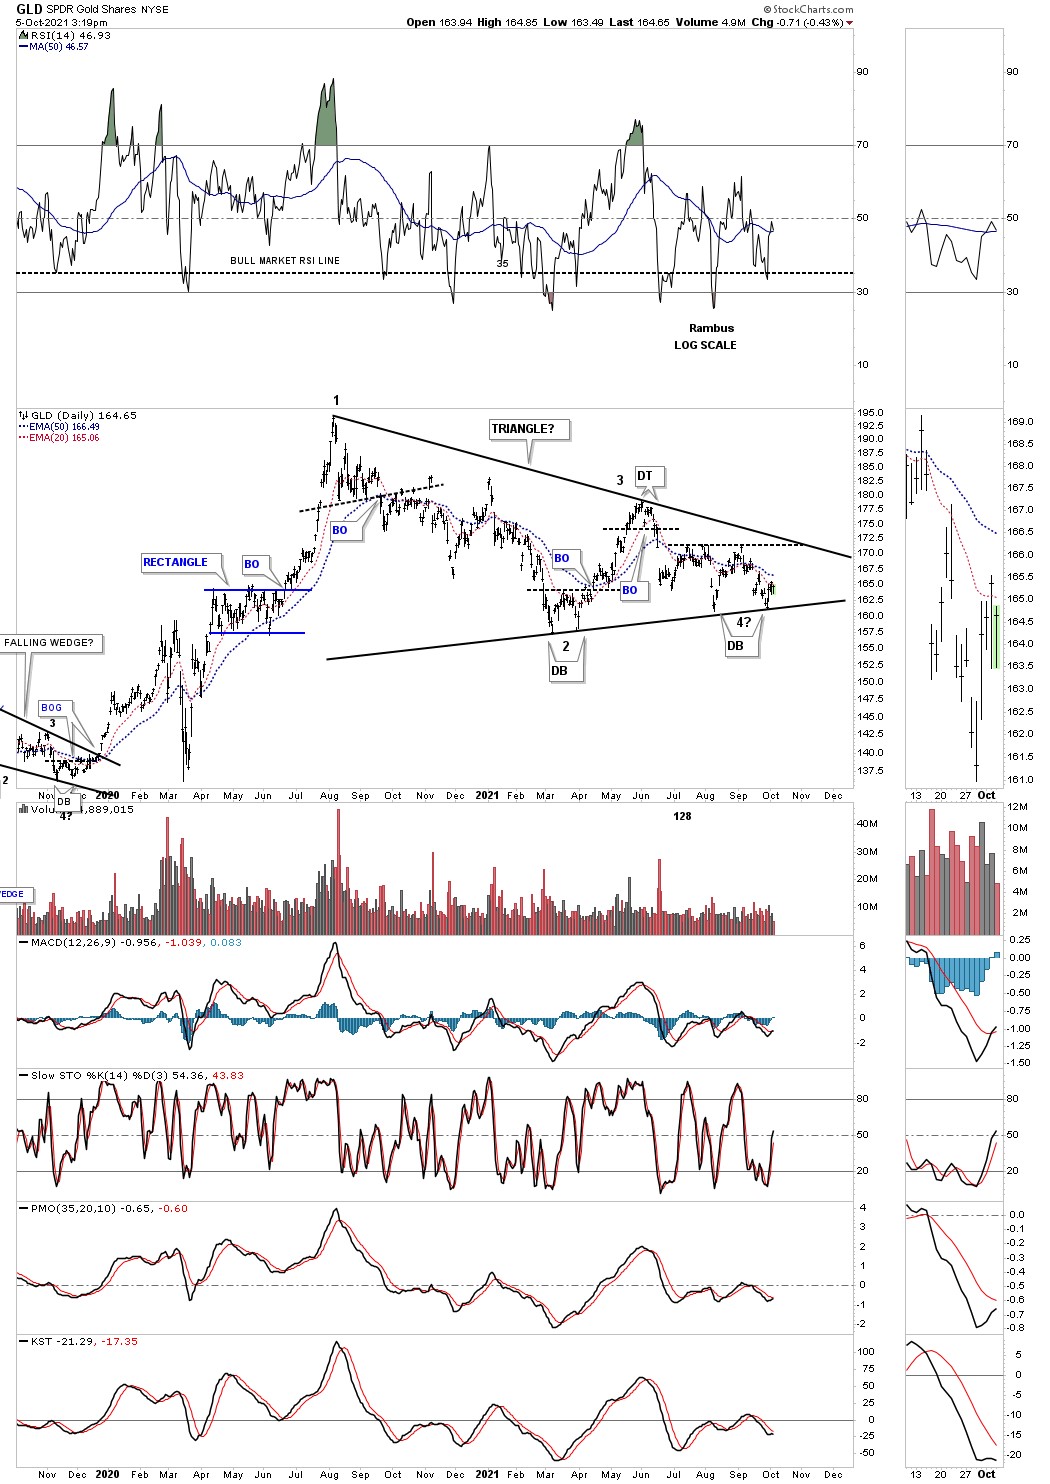
Since the 2nd low last week at the possible 4th reversal point there is a possible triangle consolidation pattern building out on this daily chart for GLD. Note the reversal patterns at the reversal points. This could be a big deal if the 4th reversal point plays out as a double bottom as that would insure a breakout of the top trendline. At some point everything will be perfectly clear but for now there are some promising looking charts that just need a bit more work.
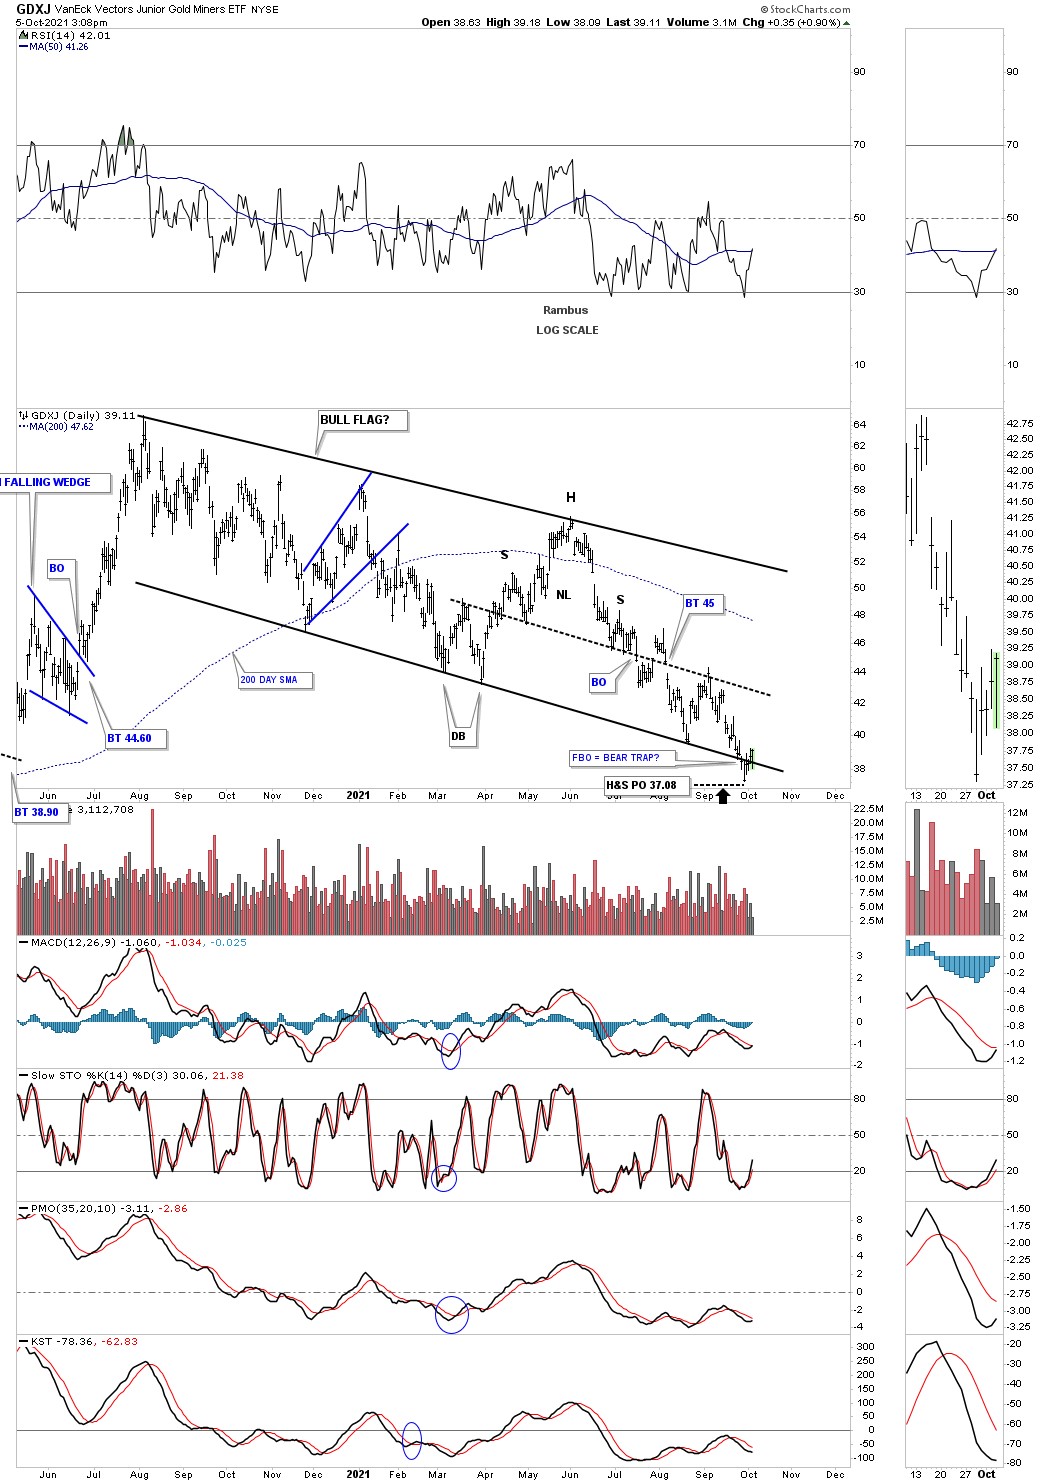
Today the GDXJ closed above the bottom rail of its August 2020 downtrend channel which could show a false breakout below the bottom rail which would equate to a bear trap if the price action can now stay above that important trendline.
This last chart for today is a long term monthly line chart for Silver which shows the potential very large H&S consolidation pattern with the neckline symmetry line now being backtested for the 2nd time around the 22 area. One thing about Chartology is that we will never miss a bull or bear market. We may be a little early or late but the big trend is always in focus. All the best.
**********
 Meet Rambus, a seasoned trader and technical analyst renowned for his unbiased and insightful chart work. Through his website, Rambus Chartology, and Substack newsletter, Rambus shares his expertise with a global community of subscribers, providing daily updates, commentaries, and hands-on training in the art and science of chartology. With his calm, humble, and down-to-earth approach, Rambus demystifies complex market trends, helping his followers navigate the challenges of today's volatile markets. Join the Rambus Chartology community today and discover a unique blend of technical analysis, trading expertise, and time-tested protocols. Subscribe now at www.rambus1.com or https://rambuschartology.substack.com/


