US Stocks And Gold Higher Into January


Last week's trading saw gold forming its low in Monday's session, here doing so with the tag of the 1463.00 figure. From there, a slingshot higher was seen into late-week, with the metal running all the way up to a Thursday peak of 1491.60 - before backing slightly off the same into Friday's session.
Gold Market, Short-Term
For the very short-term, the upward phase of the 10-day cycle is deemed to be in force with the recent action, with its last low coming right on schedule with the recent tag of the 1463.00 figure. Here again is our smallest-tracked wave, the 10-day cycle component:
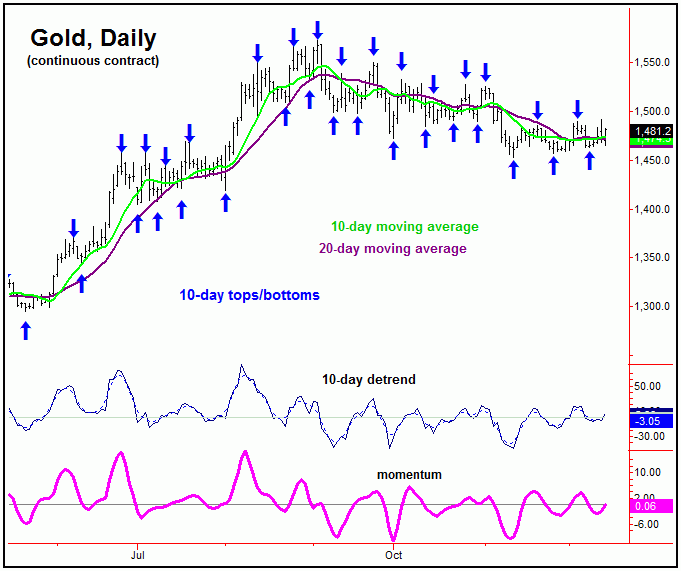
From last weekend: "the most recent high for the 10-day cycle was slightly bullishly translated to the right, peaking at the 6 trading day mark. As mentioned, its downward phase is deemed to be back in force with the decline into late last week, with the next 10-day trough projected for the December 9th date, plus or minus a day or so in either direction. If the upward phase of the 72-day cycle were to already be in force (yet to be confirmed), then we would expect the current correction with the smaller 10-day wave to end up as countertrend, to be followed by higher highs on the next swing up into later this month."
As mentioned last weekend, the last low for our 10-day wave was projected for the December 9th date, plus or minus. That bottom was made on schedule, registered on December 9th with the tag of the 1463.00 figure. In terms of patterns, as mentioned in our thrice-weekly Gold Wave Trader report, that decline was anticipated to end up as a countertrend affair - holding above the 1453 and 1456 prior swing bottoms.
Going further with the above, higher highs were seen on the current upward phase of the 10-day wave, with the metal running all the way up to a peak of 1491.60 into Thursday's session. Having said that, with this 10-day wave only 3-4 trading days along, the ideal path would be for additional strength to be seen in the coming days, before forming another 10-day cycle top, with the next correction phase of this component also favored to end up as another countertrend retracement.
Gold's 72-Day Cycle
With the action seen into late last week, we now have our best indication that the larger 72-day cycle has turned higher, ideally into what looks to be the month of January. Here again is that particular cycle:
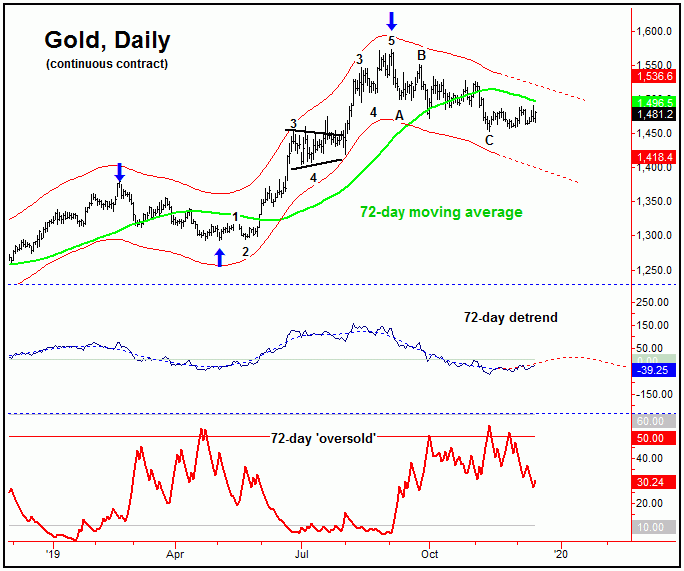
As mentioned in prior articles, the next decent multi-week rally phase has been expected to come from this 72-day cycle. If the upward phase of this wave is back in force, then we should expect to see additional strength in the coming weeks, with the 72-day moving average acting as the magnet. However, the best 'look' would be for a push up to the 50-61% retracement zone of 1513-1527 (February, 2020 contract).
Stepping back slightly, the ideal path would have the upward phase of the 72-day cycle ending up as a countertrend affair, ideally peaking in January for another decent decline into the Spring of next year. That decline would end up bottoming the largest-tracked cycle, the 310-day component for another multi-month rally - similar to the one seen off the May, 2019 lows.
Gold Sentiment
In looking at the latest numbers from the CFTC, the commercial hedgers covered around 20,000 shorts, which drops their current net short total down slightly to 302,383 contracts - with the data current to the December 10, 2019 close:
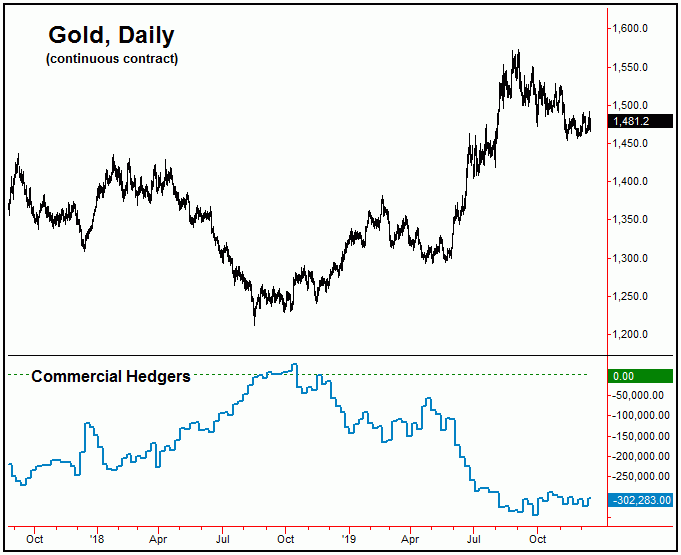
As mentioned in prior months, the current net shorts held by the commercial hedgers is seen as a bearish indication for the gold market, at least for the coming months - though the larger-picture is decidedly weighted to the bullish side.
With the above said and noted, the ideal path would have the commercial hedgers covering/exiting a large chunk of their short bets into the next 310-day cycle bottom, due again sometime around the Spring of next year. If seen, that would set the stage for the next major rally in gold, which is expected to take the metal strongly higher into later next year.
US Stocks Higher into January
As pointed out in prior articles, the last decent peak - and correction phase - for the US stock market (as measured by the S&P500 index, or 'SPX') was expected to come from our most dominant cycle, the 45-day wave, which is shown again on our chart below:
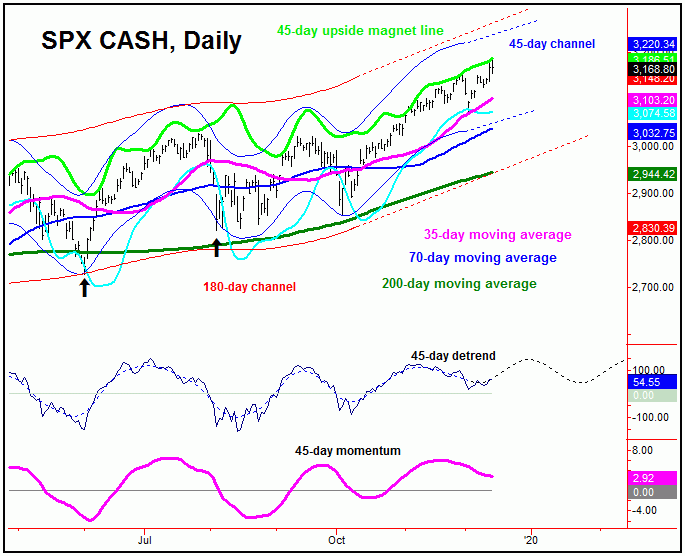
In terms of price with the above, our expectation was for a correction back to the 35-day moving average on the SPX - which we easily saw with the drop into the 3070.33 swing low. That same moving average acted as support to that decline phase, and the subsequent action confirmed the upward phase of this cycle to be back in force into what is looking to be the month of January.
Going further with the above, I keep detailed spreadsheet data on each of the cycles that I track. I then separate this data as to the pattern that the cycle then forms, and then use this data to get a semi-accurate picture of what the cycle will do in the future - both in regards to time and with price.
In terms of price then, when forming the pattern of a 'higher-low' with this 45-day component, the greater-majority of upward phases have seen rallies of 5% or more. If seen on the current rotation, then the inference is that the SPX is headed up to test the 3216 figure in the coming days/weeks.
In terms of time, approximately 80% of the upward phases of the 45-day cycle - when forming a 'higher-low' - have seen rallies of at least 15 trading days before topping, which would suggest it to head higher into December 26th or later. Having said that, the average rallies have taken 30 trading days before the cycle topped, which equates to the mid-January timeframe of next year.
Stepping back then, the next semi-important peak is expected to come from the 45-day wave, which should also end up as the high for the next larger-degree wave that we track. From that high, we would be looking for a larger-percentage correction to play out, with the exact details of how this decline will unfold noted in our Market Turns report.
Take a look at our next chart:
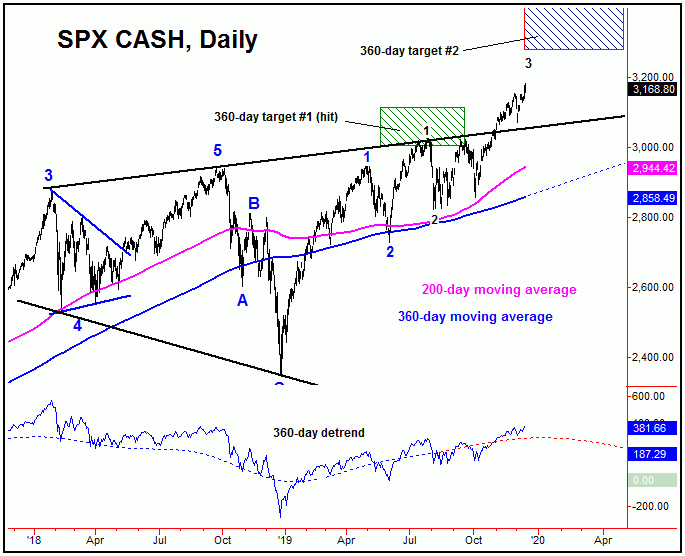
For the bigger picture, our overall assessment is unchanged from past months. Back in late-Spring of this year we noted a confirmed an upside target for our larger 360-day cycle, to the 3279.07 - 3437.63 SPX CASH region, and which is shown on the above chart. This target zone is acting as the mid-term price magnet, barring any short-term corrections in-between - with the next one of significance expected to come following the next peak with the 45-day cycle, ideally made on or past the month of January. Stay tuned.
Jim Curry
The Gold Wave Trader
http://goldwavetrader.com/
http://cyclewave.homestead.com/


