Where Is Gold Going From Here?


After briefly reaching highs above $2,000, gold has fallen to $1,785 (-14%) following the deep selling in the U.S. major indexes throughout most of April and May 2022.
Interpretation Of Current Consolidation In Gold
My team and I see the recent lows in gold as similar to the April/May 2009 consolidation after the global financial crisis. It is also similar to the January 2013 consolidation before an extended 34% price decline took place – ending in December 2015.
The primary difference between now and then is that the Federal Reserve is currently initiating a new round of Quantitative Tightening (QT), raising rates, while battling Inflation. In both the previous examples, the Federal Reserve was moving aggressively into Quantitative Easing, attempting to aid in the recovery of the U.S. and the global economies.
It seems to me, that the underlying factors driving the price of gold have drastically changed. All it would take for gold to break into a new trend, up or down, would be to see some new catalyst or contagion event come to life.
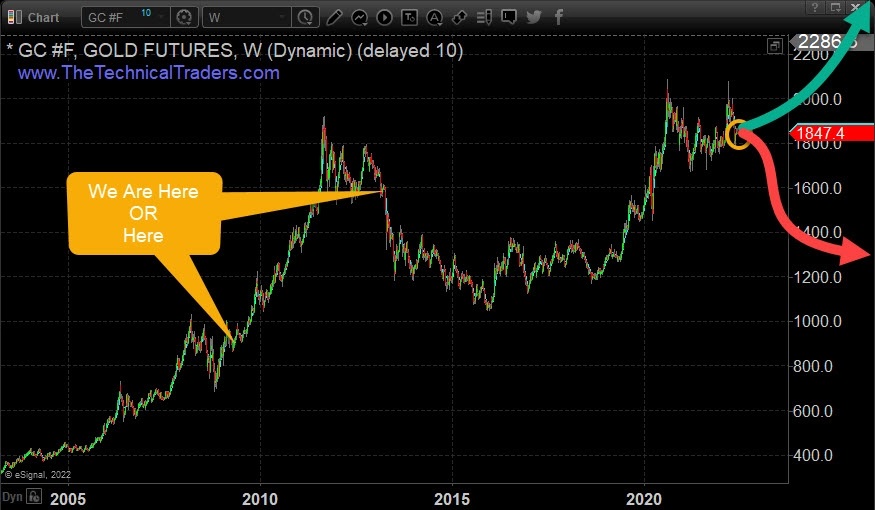
Gold Weekly Chart.
Gold Establishes New Momentum Base, While USD Rallied 15.75%
The strength of gold over the past 15+ months while combating the strength of the U.S. dollar has been impressive. I’ve shared my thoughts in many interviews over the past year, suggesting gold was in a consolidation range (moving downward), while still holding up impressively as the U.S. dollar continued to skyrocket higher.
Trends in the U.S. dollar and gold, I believe, are directly related to underlying global economic factors. These factors are prompting a shift away from traditional growth sectors and pushing traders to reconsider the safety of precious metals. Another factor is that the Federal Reserve has been actively telegraphing rate increases for nearly 12+ months as Inflation started to surge in early 2021.
I see the extended consolidation in gold over the past 15+ months, above $1,700, as a new momentum base for the price – similar to what happened in 2009 and 2013. The next question is “will it break upward or downward?”
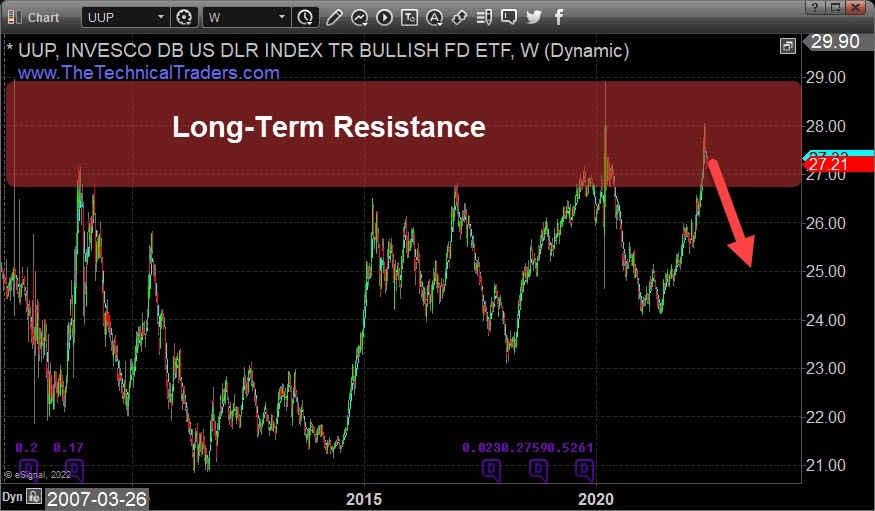
UUP Chart.
As time progresses, we’ll have to see how the dollar and gold react to the long-term resistance area I’ve highlighted on the chart above.
Plan A vs. Plan B For Gold Throughout 2022
I like to consider trading to take high probability opportunities within confirmed/defined trends. The smartest move for gold traders right now is to wait for any future price confirmation before trying to guess which direction it will move.
Plan A
Watch the $1,775 level as critical support.
Consider the current bullish price trend as neutral if any daily close breaks below $1,775.
If the price recovers above $1,775 after moving lower, adjust to a potential bullish price trend for gold.
Plan B
Watch the $1,735 level as critical support.
Consider the current bullish trend as continued bearish if any daily close breaks below $1,680.
If the price breaks to below $1,735, do not attempt to 'bottom-pick.
These Plan A and Plan B constructs are how I think of trading in general. It is not worth trying to guess where the price may go or if I’m missing out on some opportunity. Risking 5% or 10% of my capital on a guess is just not worth it to me. I could be wrong in my guess multiple times trying to chase an emotional belief that a bottom or top is setting up. This, in turn, could destroy 25% to 40% of my trading capital in the process.
If I’m patient and wait for the market price to confirm a trend, then I’ll be able to execute a high-probability trade with limited risk.
Falling Back To Long-Term Technical Analysis As A Guide
I created this chart in early 2021 highlighting my cycle expectations for gold over the next 3+ years. Throughout most of 2021 and into early 2022, I expected gold to trend downward – reaching a low price near $1,625 sometime near February-May 2022. The recent low in gold on May 16, 2022, was $1,785. Prior to that, gold reached a low of $1,676.70 on March 8, 2021.
Although my $1,625 level has not been reached yet, I am eagerly waiting for the next phase of my prediction – the potential rally wave that should start in June 2022 or soon after. This next rally phase may target $2,000~$2,050, then stall for many months before continuing to trend higher, targeting $2,400+.
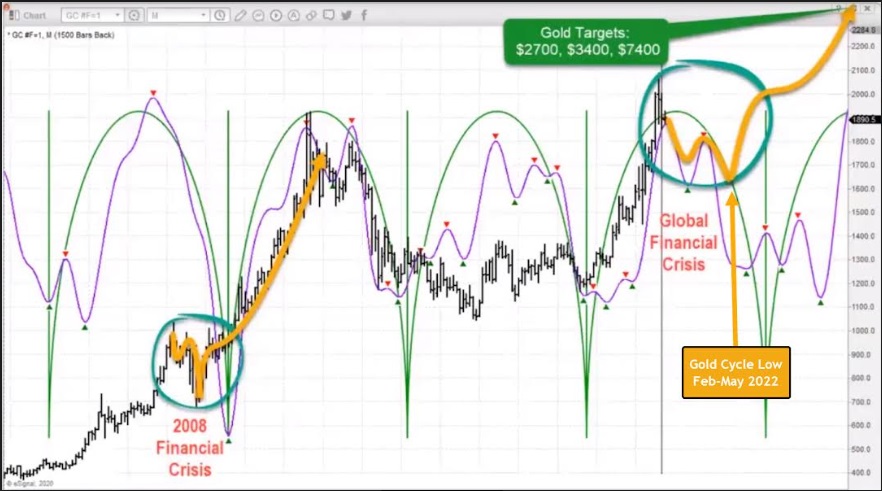
Long-Term Gold Chart.
Patience is the key to all trading and long-term success. Knowing there are opportunities for very short-term trades every day is fantastic if that is your style. I prefer to trade longer-term swing trades, protecting my capital and trading the most efficient setups.
In my opinion, the best opportunity for gold traders is to wait for price confirmation of my predicted cycles. Once this happens, then look for opportunities when we know gold has exited this consolidation phase.
WHAT STRATEGIES CAN HELP YOU NAVIGATE THE CURRENT MARKET TRENDS?
Learn how we use specific tools to help us understand price cycles, set-ups, and price target levels in various sectors to identify strategic entry and exit points for trades. Over the next 12 to 24+ months, we expect very large price swings in the US stock market and other asset classes across the globe. We believe the markets have begun to transition away from the continued central bank support rally phase and have started a revaluation phase as global traders attempt to identify the next big trends. Precious Metals will likely start to act as a proper hedge as caution and concern begin to drive traders/investors into Metals and other safe-havens.
Historically, bonds have served as one of these safe-havens. This is not proving to be the case this time around. So if bonds are off the table, what bond alternatives are there? How can they be deployed in a bond replacement strategy?
Sign up for my free trading newsletter so you don’t miss the next opportunity!
We invite you to join our group of active traders who invest conservatively together. They learn and profit from our three ETF Technical Trading Strategies which include a real estate ETF. We can help you protect and grow your wealth in any type of market condition. Click the following link to learn more: www.TheTechnicalTraders.com
Chris Vermeulen
Chief Market Strategist
Founder of TheTechnicalTraders.com
********

Chris Vermeulen has been involved in the markets since 1997 and is the founder of Technical Traders Ltd. He is an internationally recognized technical analyst, trader, and is the author of the book: 7 Steps to Win With Logic
Through years of research, trading and helping individual traders around the world. He learned that many traders have great trading ideas, but they lack one thing, they struggle to execute trades in a systematic way for consistent results. Chris helps educate traders with a three-hour video course that can change your trading results for the better.
His mission is to help his clients boost their trading performance while reducing market exposure and portfolio volatility.
He is a regular speaker on HoweStreet.com, and the FinancialSurvivorNetwork radio shows. Chris was also featured on the cover of AmalgaTrader Magazine, and contributes articles to several financial hubs like MoneyShow.com.


