Latest Gold Price Forecast & Predictions
| Period | 2 Days | 3 Days | 1 Week | 2 Weeks | 1 Month |
|---|---|---|---|---|---|
| Change | +1.10% | +1.10% | +4.14% | -0.91% | +11.34% |
Gold Price Forecasts - Analyst Predictions
Gold Forecast Short Term
Gold Forecast 1 Year
Gold Forecast 3 Years
Featured Gold Price Forecasts
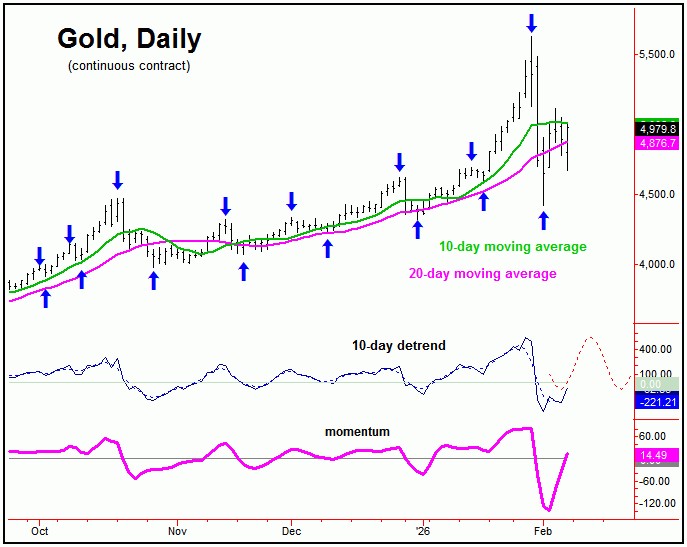
 From the comments made in past months, Gold's larger rally phase was projected to hold up into February of this year, plus or minus, though with the recent 'mini-panic' drop well overdue in the Gold market.
Gold's 10-Day Cycle
For the short-term picture, our smallest-tracked wave in the Gold market is the 10-day cycle, which is shown on the chart below:
From my 1/25/26 article: "our 10-day wave is now 4 trading days along, with the average rallies having taken some 4-7 trading days before topping. With that, the next short-term peak - and correction - should come from this cycle, which is next projected to trough into early-February, plus or minus."
As mentioned above, back on January 25th our 10-day wave was 4 days along, with the average rallies having taken 4-7 trading days before topping. From that article, price went on to spike another 600 points in the following days,...
More Gold Price Forecasts
Gold Price Forecast FAQ
How do you forecast the price of gold?
Predicting gold prices can be said to be both a science and an art. For example, analysis of gold supply and demand is scientific and completely objective whereas aspects of technical and sentiment analysis of the current gold market can be more of an art as it relies on the skills and perspective of the gold analyst.
Generally speaking, when the focus of the gold forecast is longer term then analysis of the fundamentals, ie scientific analysis, comes to the fore.
For shorter-term predictions of gold prices, the price of gold in the coming weeks and perhaps few months, technical analysis of past and current gold prices, market trends, as well as current market sentiment can be more actionable predictors. Here, the fundamentals can still play a role but generally serve more as background details.
What are the key factors for long term gold forecasts?
When forecasting what may happen to the price of gold longer term, there are many things to consider including economic trends, the impact of current and expected monetary policy, QE, debt monetization, and the aggregate impact on future currency valuation.
Does the price of gold go up when the stock market goes down?
The price of gold is often negatively correlated to the stock markets. When the markets go down, gold prices usually go up. However, this is not always true. Sometimes the price of gold and stocks both go up and down in unison. Fundamental factors play an important role and need to be carefully analyzed. Historically, however, the price of gold is not tied to the fluctuations of stock and bonds. This is one of the chief reasons when one should have gold in their portfolio – to protect the long-term value of your investments.
Does the value of the US dollar predict the price of gold?
As gold is traditionally quoted in US dollars, the price of gold is negatively correlated to the strength of the USD. The weaker the US dollar, the cheaper it is to purchase gold. Therefore, if economic factors predict a strengthening of the US dollar then this will tend to drop the price of gold, and vice-versa. According to the statistics (since 1973), the long-term correlation between the U.S. dollar index and the gold prices is -0.6 so this link is quite strong.
How do US interest rates impact future gold prices?
The level of US interest rates is an important driver of future gold prices. When investing in gold, the investor is faced with the opportunity cost of gold - a non-interest bearing asset. The higher the US interest rate for holding US dollars or investing in Treasuries, the higher the opportunity cost of holding gold. It is more likely, therefore, that a rally in the price of gold will be forecasted the lower the US benchmark interest rate.


