Stock Market Historical Valuations 1925 to 2007
Due to the effects of monetary inflation on the earnings of the Dow Jones Industrials, I have broken the data series into two charts: 1929-1979 & 1929-2007. The data is as published in Barron's. I did not index the series or manipulate the charted data in any way.
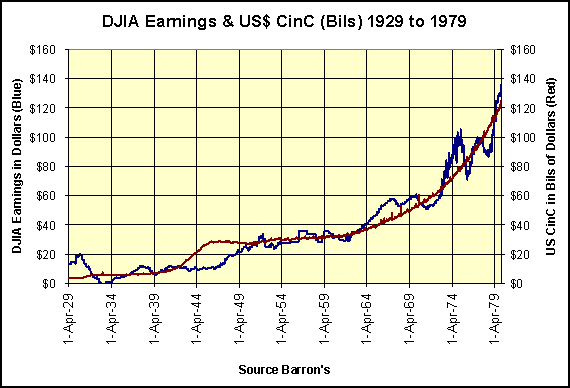
The correlation between the growth in U.S. Currency in Circulation (CinC) controlled by the Federal Reserve's Open Market Operations, and earnings "growth" in the DJIA is amazing. From 1929 to 1979, CinC (monetary inflation) appeared as a moving average to the earnings on the Dow. After 50 years of such a tight relationship, it is impossible to deny the relationship between monetary inflation and Dow Jones' earnings growth.
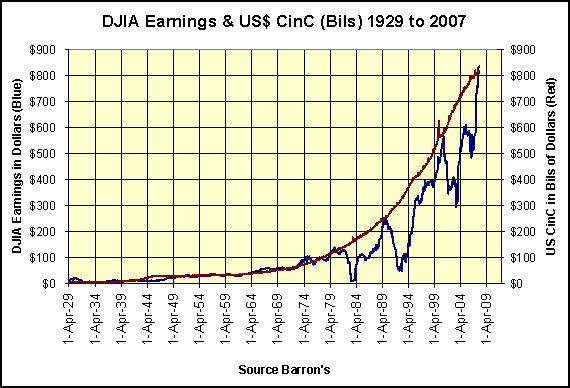
After 1979 (second chart) this 50 year relationship changed. As CinC started to rise vertically, DJIA earnings were seen wheezing and panting in its struggle to catch up with inflation. It is not hard to understand how monetary inflation could pull ahead of corporate earnings. The Open Market Committee can create money effortlessly, while companies operating in the economy managed by the Federal Reserve and other government regulators have to work very hard providing wanted goods and services in a hostile tax and regulatory environment to produce their earnings.
Post 1979 a very interesting ratio between CinC and DJIA earnings developed.
$1,000,000,000 ($1 billion) of CinC to $1 of DJIA earnings
Has meant that
Something bad soon happens to the earnings of the DJIA.
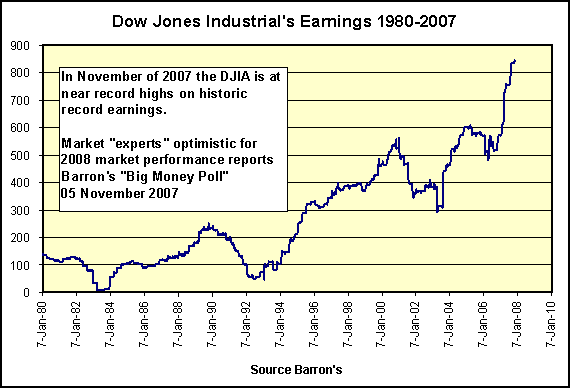
Currently we see the earnings of the DJIA have once again caught up with CinC. If this pattern repeats one more time and the DJIA earnings crash that can't be good for the near term future price of the DJIA, can it? Not necessarily correct, or so the price history of the DJIA and its earnings tells us.
The usual understanding of share prices and their earnings is that earnings are the action and the share prices are re-actions to earnings. In other words, as earnings go, so goes share prices. This understanding is the basis of "Fundamental Stock Analysis." I recognize that Fundamental Stock Analysis is an important discipline in the financial world, Warren Buffet uses it. But market history shows us that there have been times when focusing on earnings trends to predict future price trends has failed its adherents catastrophically, as Mr. Buffet's mentor Benjamin Graham discovered in 1929.
Investors must realize that their investment in the stock market is 100% dependent upon share price, and 0% on a company's earnings per share. The 78 year history of the DJIA's prices and its earnings are presented in the next 5 charts and prove my point. All too often earnings trends have proven to be the Sirens of ancient Greek mythology luring unwary sailors to their doom.

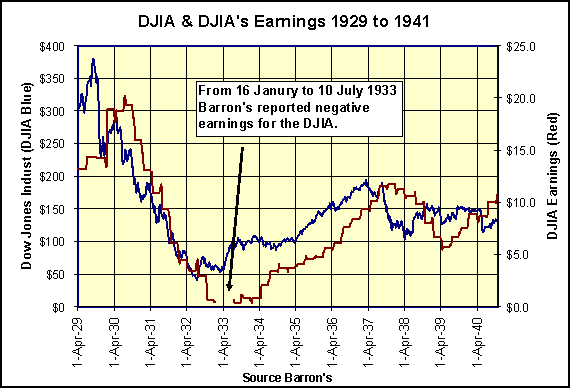
Examining the DJIA from September 1929 to July 1933, we see that the Dow and its earnings were not bolted together. These four years were a time when historic good news for earnings was really bad news for share prices, and when abysmal news for earnings drove the Dow into a historic upward move.
1929-30 Good News (Earnings) = Bad News (Share Prices)
The market top for the Dow's price peaked early September 1929, but note that the Dow's earnings continued to rise another 52% by July 1930! During those ten months the price of the Dow had dropped by 50% on these potent earnings increases. Many powerful men on Wall Street and in the financial press of the era, using fundamental earnings analysis to predict the future price trend of the market, believed in the Siren's song that rising earnings flashed the all clear signal after the October 1929 crash. But they were wrong. When the earnings of the DJIA peaked in July 1930, participants in the stock market still had two more years of the worst bear market of modern history to endure.
1932-33 Bad News (Earnings) = Good News (Share Prices)
The amazing event of the Great Depression's stock market was the 12 month period from July 1932-33. What follows is fascinating market history! On 08-July-1933, the DJIA had bottomed at 41.22, for a total loss of -89.18% from its high of 381.17 on 03-Sept-1929. Look at what happened between July 1932 and July 1933 in the above chart within the box. The DJIA had its best year in history rising from 41.22 on 08-July-32 to 105.04 on 07-July-33 for a 12 month gain of 154.82%! And what were the DJIA's earnings doing during the Dow's best year ever? The Dow's earnings were either crashing or mired in negative territory. Any investor who waited until the Dow's earnings became positive missed the entire move, as the market went flat for two years when positive DJIA earnings were finally reported.
To see all 79 years of history for the DJIA and its earnings as recorded in Barron's I have included four other charts below covering Dow history from 1929 to 2007. After reviewing the first seven charts of this article, (3 above & 4 below) you may conclude, as I have, that studying the Dow's earnings trends may be better suited for studying the failures of the Federal Reserve's Open Market Committee's operations than to trying to use earnings data for making profitable investment decisions.
People with money in the stock market would do well studying the following charts. "Experts" talk endlessly about the Red line (earnings), but it is the Blue line (stock price) that makes or loses investors' money.

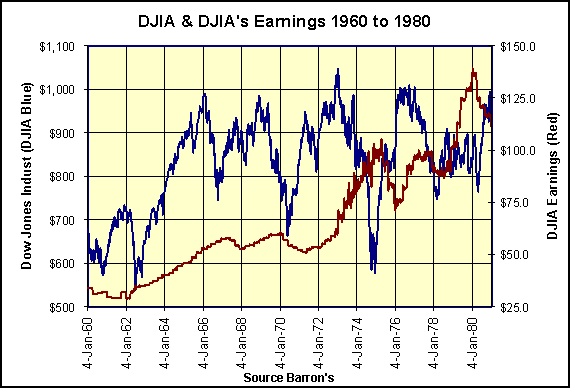
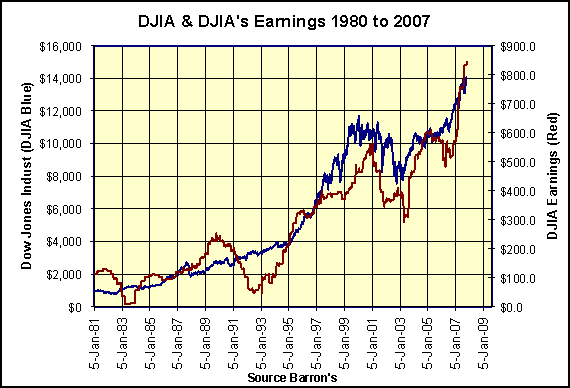
For the past 78 years, earnings all too frequently were either a non factor or a misleading indicator of future stock price trends. Technical analysis of share price trends (a discipline which ignores earnings) has proven over the years a more reliable tool for making profitable investment decisions. But I admit there were times when earnings provided good information on the future direction on the DJIA, but how long do such periods last? Not to long is the answer. Look at the chart that covers 1973-74 Dow Jones bear market. That was the sixth worst bear market fall in the history of the DJIA and earnings misled investors in 1973-74 as they did in 1929-33. Ouch!
So why do earnings get so much attention in the financial media? Earnings are currently promoted as a big deal because the new financial media is broadcasting 24 hours a day; they need something to fill up air time. Earnings are something that "experts" can talk about for hours, day after day.
Reviewing the chart covering 1980-2007, we notice that the relationship between the Dow and its earnings tightened up quite a bit after 1994. I suspect this is a self fulfilled prophecy of the 24 hour news channels like CNN and CNBC. Current financial reporting has made an enormous issue on stock market earnings, and investors act upon these reports.
Remember CNBC's quarterly "Beat the Street" game from the late 1990s? Talking heads on CNBC would speculate for days on Wall Street's "consensus earnings estimates" prior to the actual reporting of a particular company's earnings. When then glamour companies such as Enron, Tyco, Worldcom, Global Crossing, Fanny Mae and Freddie Mac's earnings actually came across the news wire and "Beat the Street" by a penny (it was always a penny!) the share prices took off! But these were all companies that had serious earnings problems that somehow eluded the TV "experts" attention.
Remember eight years ago, the 1990s bull market "experts" failed to dig deeply into the accounting of their era's glamour stocks' reported earnings. In 1999, when Martin Weiss called Amazon.Com "Amazon-Dot-Bomb" and David Tice questioned Tyco's financials, the Tout TV "experts" excoriated Mr Weiss and Mr Tice non-stop for days. When the Amazon bomb went off in 2000 and Tyco became a target for official inquiries, all was silent on the televised financial front as the bull market "experts" marched to the rear lines behind the cameras.
But in 2007, they're back. Some of the faces from 1998-00 can again be seen providing "expert" analysis on TV. Most expertly, these people have ignored the off balance sheet issues, particularly the totally unregulated, multi hundreds of trillions of dollars in nominal value derivative market. Who are the counterparties to these derivative contracts? I don't know. But as this is a market made by the huge New York money center banks, it seems likely that these "derivative products" were marketed and sold to their clients, the companies in the DJIA, S&P 500 and NASDAQ 100 Indexes.
The derivatives themselves may be off the balance sheets of corporate America, but if something unexpected happens, these derivative contract's unspoken contractual obligations will impact the earnings statements of these huge companies. I suspect that the current "sub-prime" mortgage crisis is only a smaller version of what is to come with the earnings of American blue chips corporations. History has shown that once before, the Dow's earnings went into negative territory - it could happen again thanks to off balance sheet derivatives contracts.
Is there any value in following earnings? Yes there is. The Price / Earnings Ratio (P/E) can at times be very helpful. The P/E is created when the Dow Jones Price is divided by the Dow Jones Earnings. To compute the P/E, we only have to divide the Blue Plots by the Red Plots from the 4 charts above; the results are seen in the Red Plot below. The below Blue Plot is my Bear's Eye View (BEV) plot which shows how far the DJIA has fallen from its last all time high.

However, looking at the BEV chart below for the DJIA from 1885 to present, you can see that with the exception of 1929-32 bear market, anytime the market decline approaches -40%, investors are provided with an excellent low risk entry point into the market. All this without any considerations to earnings! Investors looking for a timing system for when to buy and when they should take their profits would do well to study my DJIA BEV chart below showing the entire 122 year history of the Dow Jones Industrials Averages' Bull and Bear Markets cycles.

Bear markets are from the 0% line to -30% or below. Bull markets are from -30% and below up to the 0% line. The -30% is just a guide line, not a hard rule. It would be a mistake to attempt to catch the very top or bottom of a big move. But using my BEV chart provides a means to gauge when the market is approaching a potential top or bottom.
Just remember, when the markets approach the -30% BEV line, expect financial news from market "experts" to be very bad news in the main. Like Napoleon's troops, successful investors are the sort of people that charge towards the sound of cannon fire when others are running away. If you have the means, go read Barron's for July 1932, October 1974 or any point in time given on the BEV chart where the plot approaches -30%. These old issues of Barron's are on film and available in many major metropolitan libraries. That is where I have been going for years to get my data.
Remember, bad news, really bad news is what you actually want to see at a bottom. Think of yourself as a shark and bad news is blood in the water. But sharks have money to purchase the depressed stocks people are selling for cheap. So if you hadn't sold a good portion of your position while the BEV chart was on the 0% line, you too will be another much reduced tuna as markets move as they always do towards the -30 or more line.
But like all tools for timing the market, there are times when such a system fails or the patience of the investor fails the tool. Between 1941 & 1970 (29 years between -30% signals) this -30% rule would have kept the 1943 to 1969 investors out of a very profitable bull market as they waited for their -30% signal to enter the market. This example brings us to another iron rule in the markets: the future is always uncertain.
So how important are "expert" earnings projections for investors? Not much. In fact I would say with confidence that my BEV chart for the DJIA from 1885 to the present provided a better tool for a long term investor than "expert" fundamental earnings research for profitable market timing. Market down by minus 30%, start thinking of buying. Market at a new all time high (plot at 0% line) let your profits run for awhile but don't wait too long before you take some, or even all of your money off the table. The real key to success is to buy when everyone else is selling and sell when everyone else is buying and that is what the BEV chart does for investors. Just don't let the siren song of earnings cloud your decisions.
Let us look at one more chart. The Dow Jones Industrials may be at historic highs, but I smell a rat. The current situation in the financial markets is one of exceptional risks. The 122 year standard of selling after the DJIA's BEV reaches the 0% line and buying after it falls -30% to -40% may fail us like it did for people in 1929. There are many issues that must be resolved before I would consider entering into the stock market again:
- excessive political influence in the market;
- unending Federal Reserve "liquidity injections" in the markets;
- astronomical financial leverage via unregulated derivatives, in the markets;
- consumptive debt burden of government, business and consumers in the economy;
- Future (like right now) Social Security and Medicare funding requirements.
The list goes on and on, but really it comes down to one thing - exactly what does America expect from its markets? If society allows politicians to use the markets and the economy they support as electioneering props every two years, or ignores the huge New York financial houses manipulating market prices to maximize their proprietary trading desks profits, or believes that the financial markets will make good all the bad financial decisions made by an entire generation, my advice is to keep your wealth far away from New York. People need to lower their expectations of what buying and selling personal property can do for the world.
What happened in the stock market from 1921 to 29 was a bull market made possible by monetary inflation. 1929 to 1932 proved that what politicians and central bankers created - a dose of reality can take away. Currently, even on record DJIA earnings, I would not rule out the possibility of a 1929-32 scale market event in the not too distance future.
8 November 2007
[email protected]


