$200 Daily Advances in the Price of Gold?


The Dow Jones this week made four new BEV Zeros, four new all-time highs in its Bear’s Eye View (BEV) chart below. Since last November when the Dow Jones entered scoring position (BEVs spanning from -0.01% to -4.99%), and for the most part has remained there these last ten months, it has made thirty-three new all-time highs. A nice, and growing cluster of new all-time highs seen accumulating on the red-line I placed at the 0% line.
This isn’t the first cluster of BEV Zeros the Dow Jones has seen since 2006 in the BEV chart below. For the past eighteen years, many such clusters are seen, with each driving the Dow Jones into market history. In October 2006, the Dow Jones made a BEV Zero when it closed at 11,727, 30,000 points below where it closed today. Yet in October 2006, like at today’s close, it produced a BEV Zero, a 0.0% in the chart below. Because like this week’s close, each was then a new all-time high for the Dow Jones.
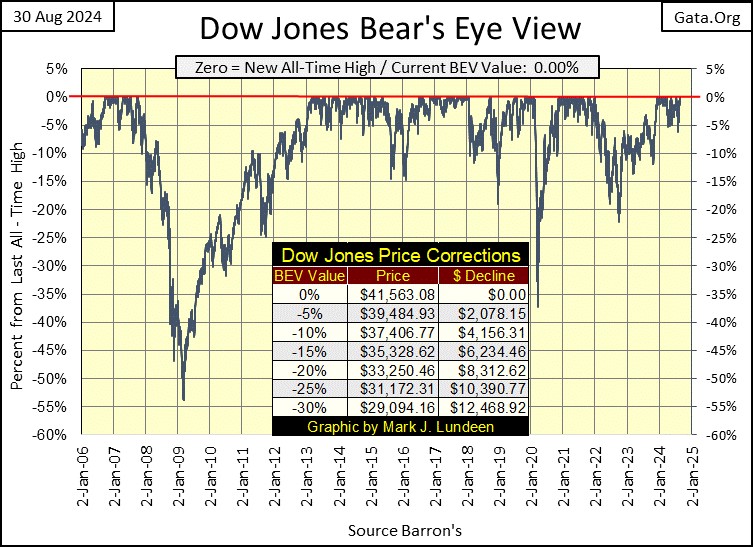
That is the key in understanding what is seen above; a BEV chart doesn’t care about dollar valuations, it plots only new all-time highs (0.00% = BEV Zeros), and the percentage claw-backs Mr Bear has taken from those all-time highs.
For people who have followed my BEV charts for a while, it may seem I’m beating a dead horse with explaining the functioning of a BEV plot as frequently as I do. But every week, there are new readers to my articles, and for their benefit, I must spend some time explaining what is seen above.
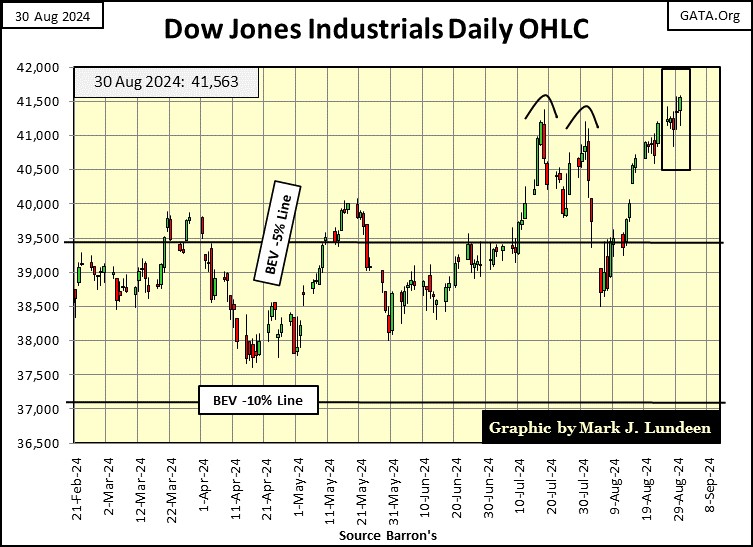
Below shows the Dow Jones in daily bars. Does it look like the Dow Jones made four new all-time highs this week? It doesn’t to me, but it did. Obviously, what the bulls were lacking this week was a little enthusiasm for the work at hand. Maybe they will return to work next week, and display a bit more effort on an attempt for 42,000. And then maybe not.
One fact I find impossible to let slip from my mind; is this is a bull market that began in August 1982, when the Dow Jones was closing below 800. After forty-two years, the Dow Jones is now closing above 41,000, making this one geriatric bull market. In terms of time and points, how much more does this bull market have to offer the bulls?
I don’t know, and I stopped thinking along those lines, as rational as that may be, as it doesn’t seem to matter. Because, what is driving this market higher is the monetary inflation (“liquidity”) being “injected” into it by the idiots at the FOMC. Sure, the stock market is going higher, but so too is the price of food and everything else. Not much of a bull market, when one looks at that way.
But it is, what it is. So, that is why I placed the BEV -5% line on the 39,484 level in the chart above. As long as the Dow Jones in its daily bar chart above closes above this line, I’m going to assume the Dow Jones will continue adding to its cluster of new all-time highs. Should the Dow Jones close below its BEV -5% line, or better a BEV of -6% or more, I think investors should reduce their exposure to the stock market by locking in some profits by selling. Should the Dow Jones close below its BEV -10% line, it would be wise to get out of the market completely, and not reenter unless the Dow Jones is once again closing above its BEV -5% line.
The fatal flaw in 99% of all retail investors’ investment strategy is; they have no exit strategy. They have no clue of when to get out, and stay out of the market. No bull market lasts forever, not even this one. It’s been that way since the 17th century’s bull market in tulip bulbs in Holland.
One common theme the old letter writers would stress, is the folly of attempting to sell at the absolute top of a bull market, or buying at the absolute bottom of a bear market. If one could, go for it. But in fact, no one knows what the absolute top, or bottom of any bull or bear market will be. Getting out within 10%, or even 15% of the top, or buying within 10% or 15% of the bottom, is a financial feat to be proud of.
Making money in a bull market, and not losing money in the bear market that is sure to follow, was, and still is the whole point of risking your hard-earned money in the market. As far as selling at the top of a bull market, for a retail investor to get out within 10% of the top of a bull market, and staying out during the following bear market, is an achievement most professional money managers would envy.
By looking at this bull market with the Bear’s Eye View, with its focus on percentage declines from all-time highs, makes this easy. For as long as the Dow Jones remains in scoring position, enjoy your capital gains. But, the next time the Dow Jones is down 10% from its last all-time high, it would be wise to be 100% out of this geriatric bull market. And don’t come back unless the Dow Jones is once again in scoring position. That way my readers keep their gains, while others take the losses.
Looking at my major market indexes’ BEV values in the table below, the stock market had a good week, with lots of BEV Zeros, new all-time highs. The week closed with seven of these indexes at new all-time highs, and six others closing in scoring position.
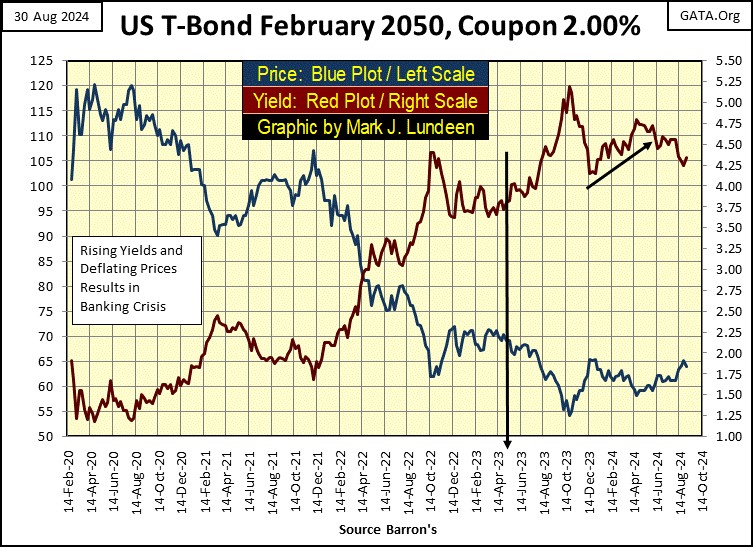
The NASDAQ Banking Index (#20 table below) closed the week with a BEV of less than -20%. We haven’t seen that for a while. Back in May 2023, these banks’ BEVs were below -50%, due to a few banks in Silicon Valley closing their doors for lack of liquid reserves. Rising bond yields, falling bond prices forced them to close their doors to their depositors asking for their money back.
This 30yr T-bond lost 42% of its value (Blue Plot) in the bond market, as yields (Red Plot) rose from August 2020 to May 2023. Rising bond yields caused a crisis in banking, not all that long ago. Should bond yields once again begin to rise, and they will, another crisis in banking will happen again.
Look at all those BEV Zeros for this week.
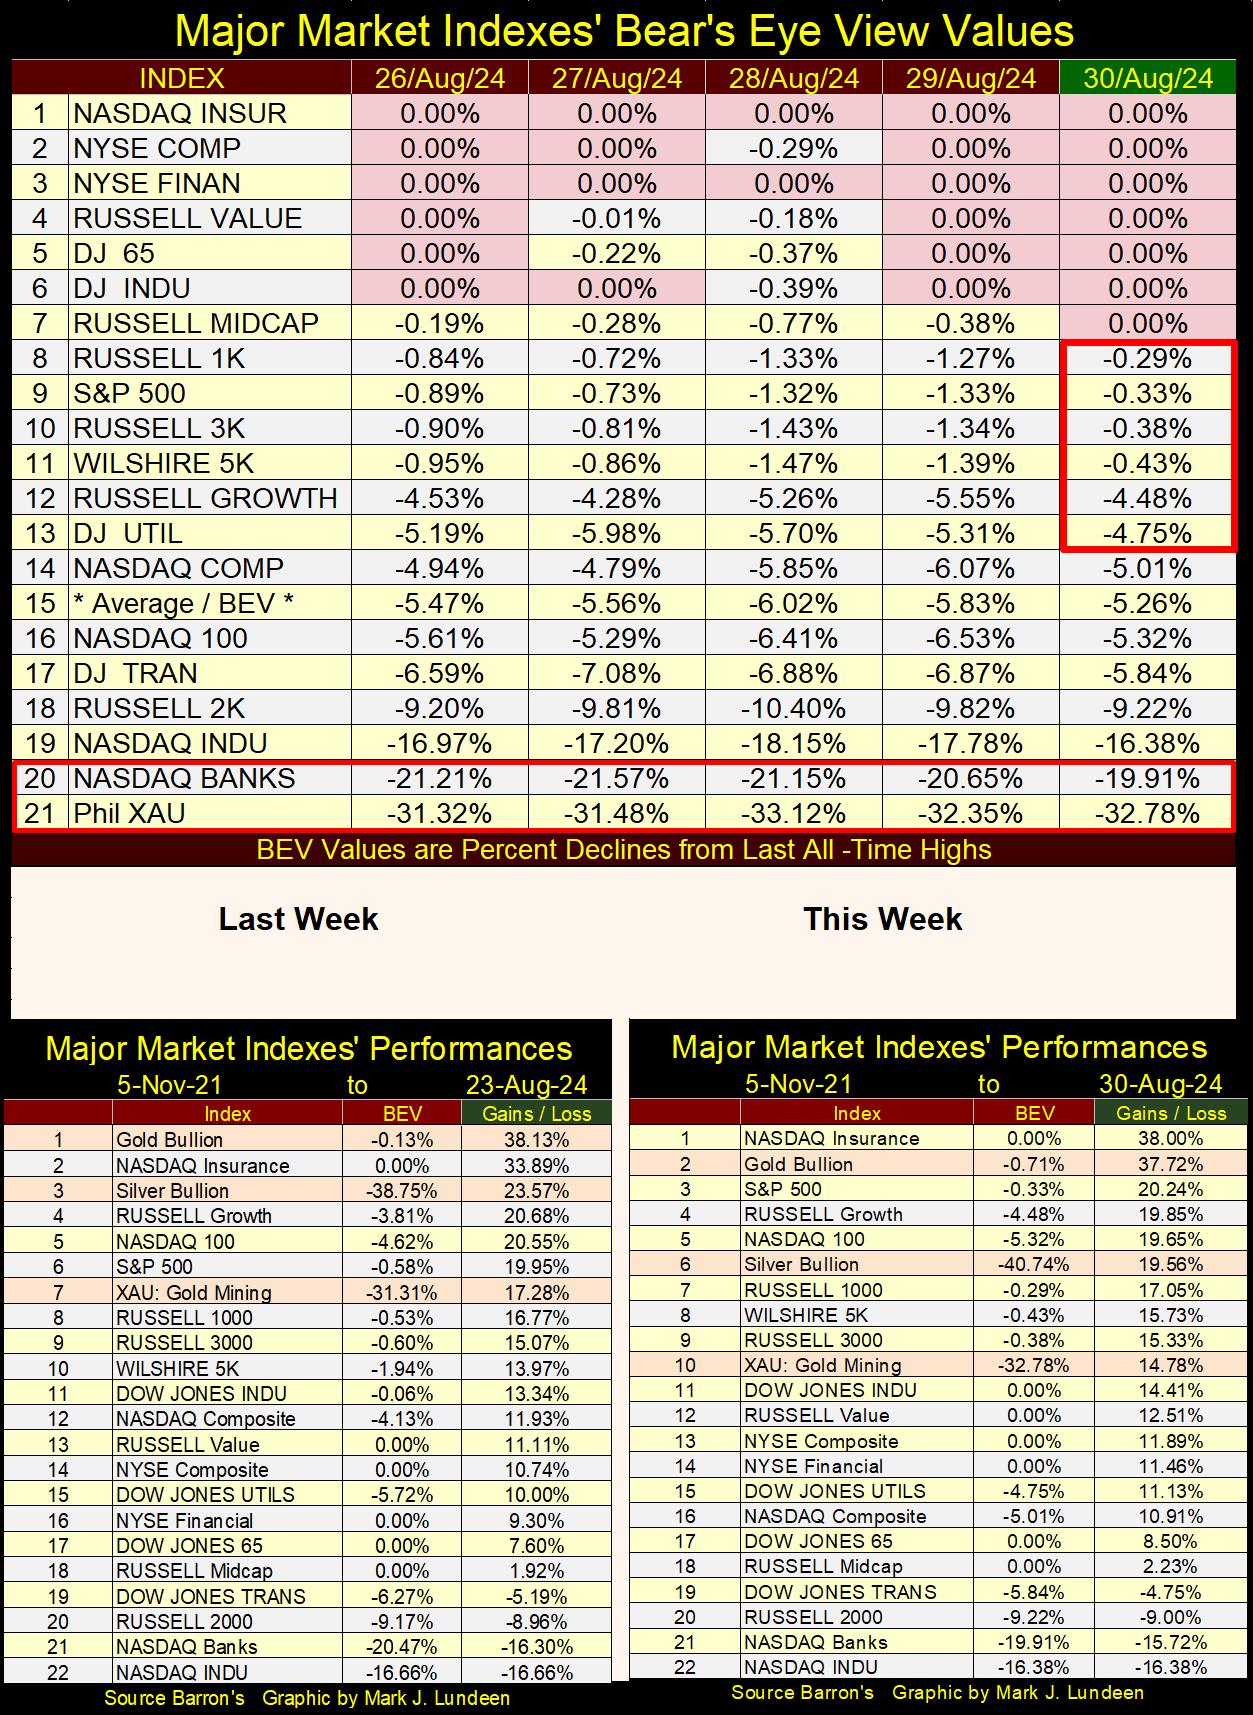
In the performance tables above, this week, everything precious was knocked down by a notch or more. What in the heck is with the NASDAQ Insurance Index? These insurance companies have been doing really good for a long time, and this week they knocked gold down to #2. Give it some time, everything precious will be back at the top.
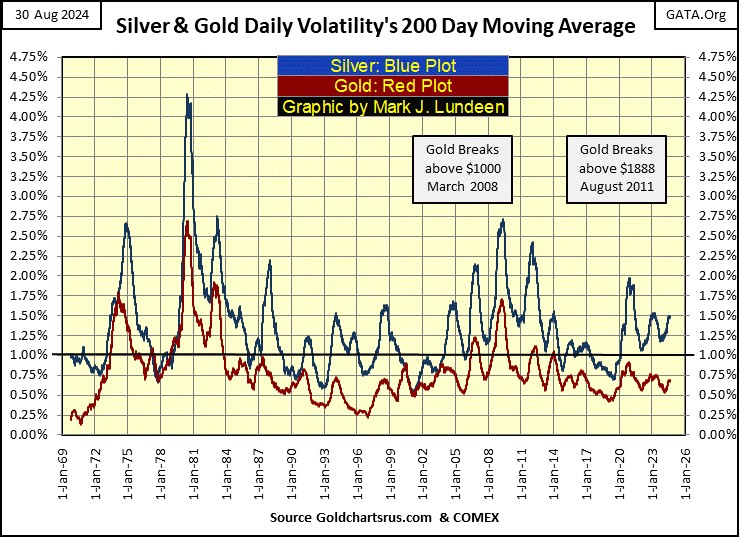
Gold’s daily volatility’s 200D M/A closed the week at 0.68%. Below is a chart of this metric, for both gold (Red Plot) and silver (Blue Plot), going back to 1969. Daily volatility for both gold and silver have been in lockstep these past six decades, but silver is the more volatile of the two. Not that this has helped the bulls in the silver market, not with silver’s last all-time high still from January 1980.
When silver breaks above $50 an ounce, and continues rising towards $60 and higher, it will be a monumental market event for the 21st century, an event that will be much commented on by market historians not yet born. What its daily volatility will look like in the chart below, when this happens, should be very interesting. Will silver break above the 4.25% it saw in 1980? It very well could.
Next is a chart for the raw data used for the plots above, however I filtered this data using +/- 3% for gold, and +/- 5% for silver as thresholds, as including every day’s volatility does nothing but make these charts noisy and confusing.
Why use 3% and 5% as thresholds? Because in my work, I follow what I call days-of-extreme volatility, days where a market series’ price rises or falls below its previous day by a certain percentage;
- Dow Jones = +/- 2%,
- gold = +/- 3%,
- silver +/- 5%.
These threshold values are chosen by me, because they seem to work; are seldom seen, except for when something exciting is happening in the market.

First is gold’s daily volatility, those days since January 1969, gold saw a day-of-extreme volatility; +/- 3% daily move for gold. I direct your attention to the table in the chart. Since January 1969, gold has seen 443 days-of-extreme volatility, aka 3% days to keep it simple, with most of them occurring during gold’s first bull market – January 1969 to January 1980. Since December 2000, gold has seen only 111, 3% days.
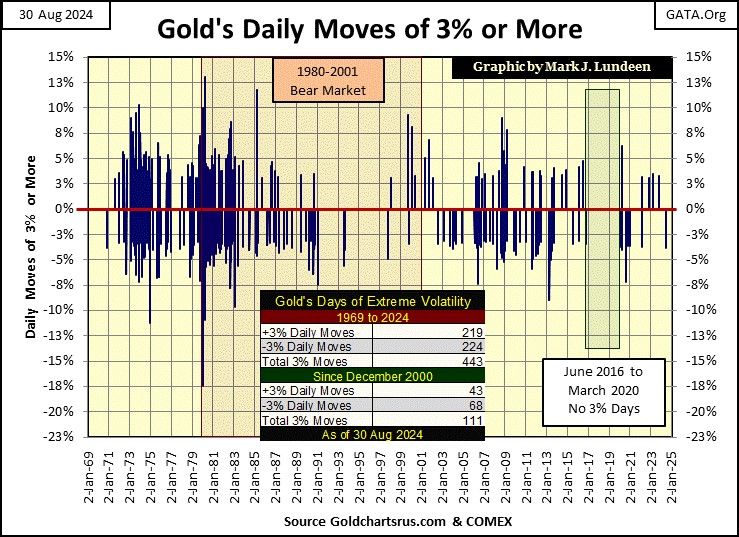
Why the difference in the volume of 3% days for gold, during its first and second bull market? Speaking as a market enthusiast, but one who has followed the precious metals markets for decades, I would say the government, and its “market regulators” have made their presents felt in the gold and silver markets to a much greater degree since 1999, than they did before, as it became a matter of survival for them.
Such as gold’s price increase in the summer / autumn of 1999; from $253.70 on 19 July 1999 to $324.5 on 06 October 1999. It’s hard to believe, but this $70.80 rise in the price of gold, created a crisis in central banking.
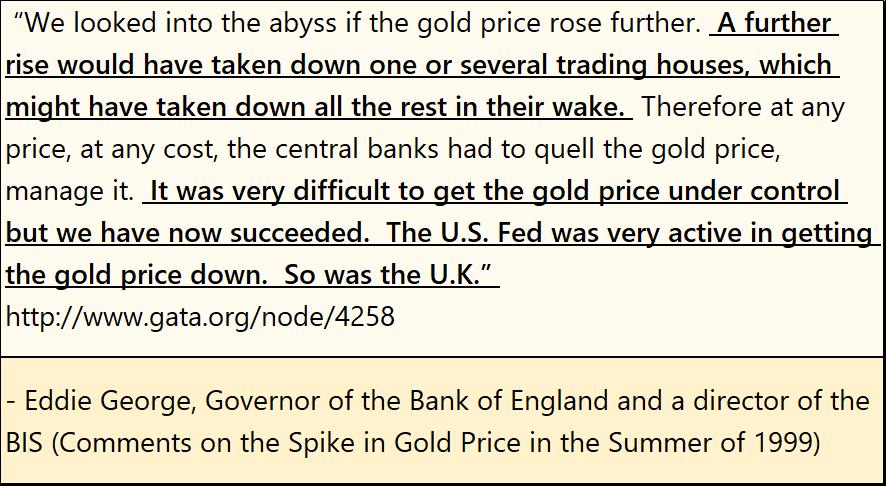
Twenty-five years ago, a $70.80, 28% increase in the price of gold almost took down the global banking system. Today in 2024, how many people, including “market experts” know that? I’ll tell you some people who haven’t forgotten what happened in 1999, the idiots at the FOMC, as well as their Idiot Primate Powell.
Decades before 1999, it was the government that terminated the dollar’s $35 gold peg in 1971, assuring everyone gold was no longer needed. They were in shock when in the next eight years, gold soared from $35 an ounce, to over $800 in January 1980, as bond yields and CPI inflation soared into deep double-digits. By 1980, their unbacked by gold, paper dollar was dissolving in front of everyone’s eyes.
This shouldn’t have surprised anyone. During the 1820s, with the Second Bank of the United States, America’s Federal Reserve of the time, paper money issued by this central bank did the exact same thing. Below is a quote from Daniel Webster, a member of Congress at the time;
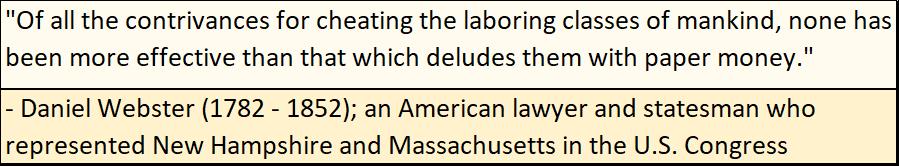
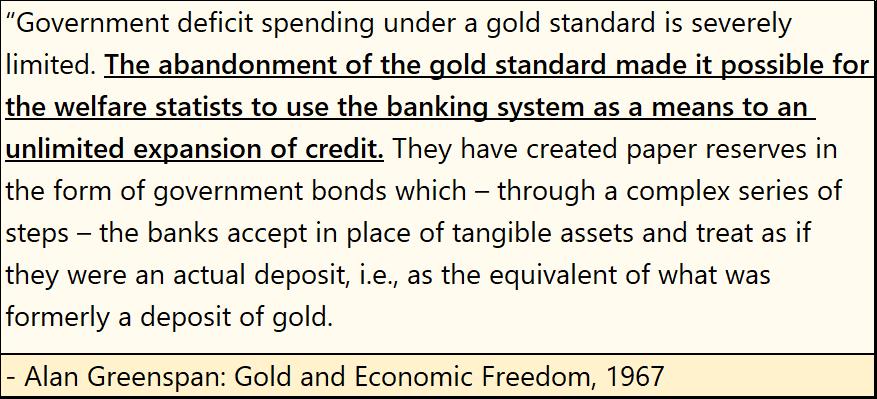
Banks and governments hate gold. Always have, aways will. As gold as money, is a check on their banking system’s ability to create currency and credit, as admitted by Alan Greenspan in 1967, before he joined the dark side of the force.
Going back to the chart above, from 1969 to 1980, seeing gold advance by 8% from the day before, while not a frequent market occurrence, were not unknown. Since the 2001 start of gold’s second bull market, gold has seen an 8% daily advance only twice, during the sub-prime mortgage crisis.
What would an 8% daily advance look like today? From Friday’s close of $2,503, a daily advance of $200 from the day before, would be an 8% day. Is that possible? Oh yea, that and more. Of course, as seen in the chart above, when the gold market is seeing days where it is advancing by 8% from one day to the next, it is also seeing the price of gold declining by 8% from one day to the next. Don’t let Mr Bear, playing his little games, freak you out during a bull market.
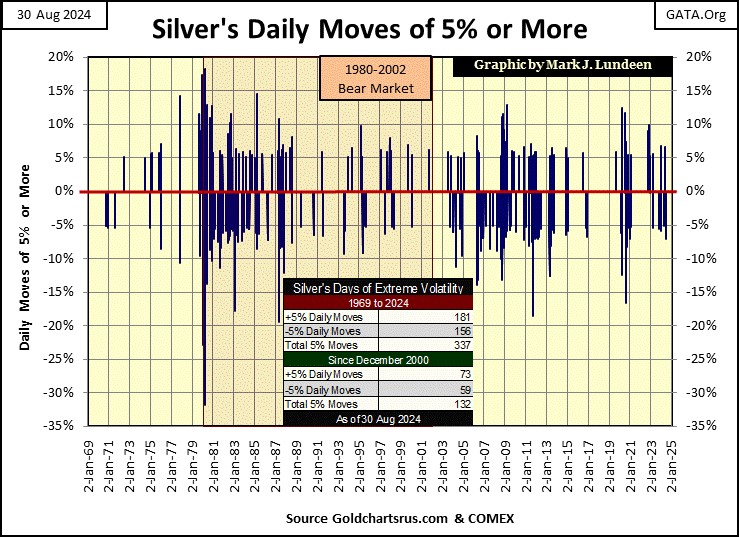
Here is silver’s chart plotting its 5% days. I’m publishing this with no comment, not because I don’t like silver. I like silver a lot, actually more than gold. Its just that one should look at it as we did with gold’s chart of 3% days above.
Let’s move on to gold’s BEV chart below. This is a nice slice of market history, a study of; did you see that? Something changed!
- Note the Red Line at the BEV -27.5% line ($1,362). From 2012 to 2019, for seven years, every time the price of gold increased, and touched this line, it was immediately whacked back down. Then came June 2019, when something changed in the BEV chart below; gold broke above its BEV -27.5% line, and kept going up, as only a few market watchers noticed.
- Gold continued going up, until in August 2020, it did something it hadn’t done since August 2011, nine years before; it made a BEV Zero, a new all-time high. Not just one, but five of them.
- For the next three years, gold was either going down, but not below its Red Line, or advanced, but failed to make a new BEV Zero.
- Then in November 2023, gold entered its scoring position (closing within 5% of its last all-time high) * AND * has stayed there now for ten months, making a cluster of BEV Zeros, twenty-nine of them so far. Something gold hasn’t done since 2011, and what a huge change that has been!
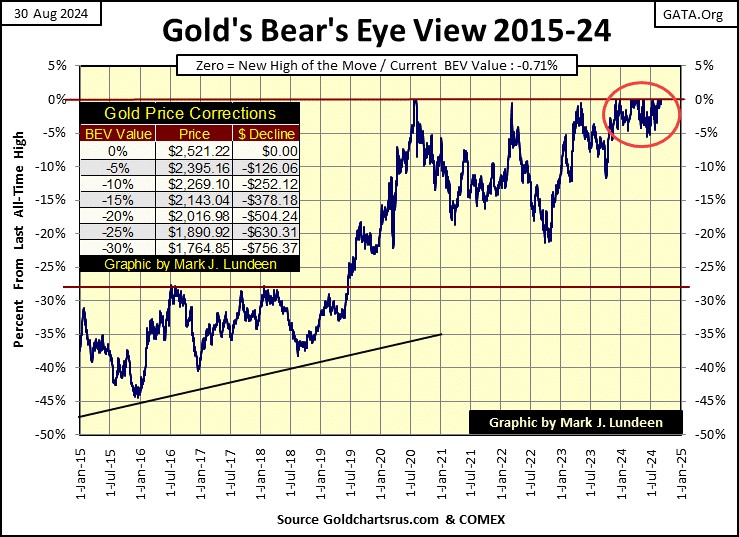
I look at gold’s BEV chart above, and I see the drama played out between the bulls and bears in the gold market for the past decade. It’s a story of growing strength for the bulls in the gold market, strength the bears in the gold market have so far been helpless to overcome.
Unless something changes, which can happen, something like; well, I can’t think of anything that would make become bearish on gold. Until then, I have to believe gold has only one way to go in the months and years to come; to much higher levels from where it closed this week.
We are still very early in this bull market for gold. Meaning the public and managed money are still not moving into the gold market. So, should gold fall back to its BEV -15% line ($2,143, as seen in the table on the chart), that doesn’t change anything, except to shake the weak hands in the gold market, out of their positions.
Let’s now look at the indexed values for gold and silver, going back to 1969 below.
Gold (Red Plot) is looking very hard at its 60.0 level. The Good Lord willing, by his birthday on Christmas, maybe I’ll have to increase this chart’s scale to 65 or 70. In a good market, this is something that would not be hard to do. But, are we going to have a good market for the last four months of 2024? I think we will, but this is an election year, so anything can happen.
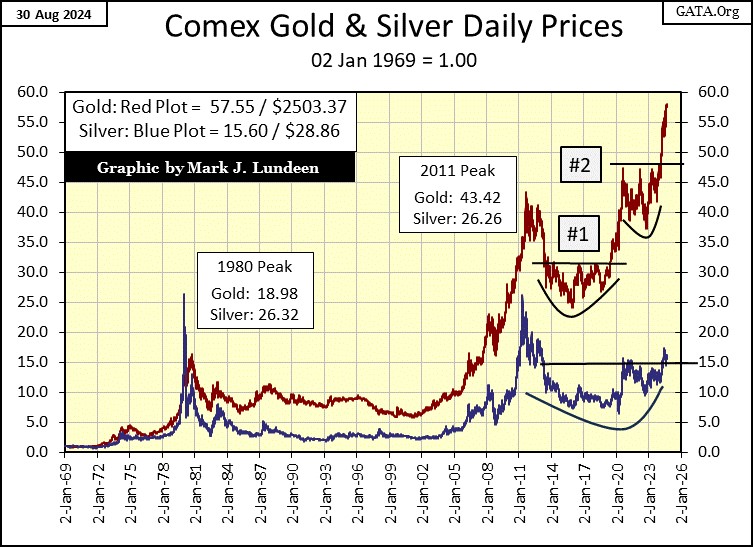
Silver above (Blue Plot) is a study of how somethings never change, or so it is beginning to feel to me, as silver has yet to make its big break out. In time it will, but I don’t care to wager a beer, or a couple of hotdogs up here in the market’s peanut gallery when that will be. Still, when silver does break out, its advance to higher levels should be impressive, making the wait well worth the while.
Below in gold’s and the Dow Jones’ step sum tables, we see a study of opposites. While both have been making new BEV Zeros, noted in the blue highlighted cells, it’s how these two very different markets have been making their new all-time highs that is so very interesting.
On gold’s side, note its 15-count closed the week with a -1. In other words, in the past fifteen days, eight have been down days, with only seven of these fifteen days, advancing days. But most of these advancing days closed with a new all-time high for gold. I have to chuckle when I look at gold’s last fifteen days in the table below – look at all those Red down days between gold’s Blue BEV Zeros!
Markets being markets, they see periods where advancing days overwhelming declining days, and currently, gold is advancing to new all-time highs in a period where declining days are overwhelming its advancing days. This is something one doesn’t see very often.
This could go on for another week or so, and then maybe we’ll see gold with a 15-count of -3 or -5. This begs the question; what does gold do when once again, it sees advancing days overwhelm its declining days?
Maybe nothing special is the answer to that question, and then maybe something really bullish happens sometime in September; a big break out in the gold market. It could go either way, but I really like this bullish setup for September. I’m excited to see what comes of it.
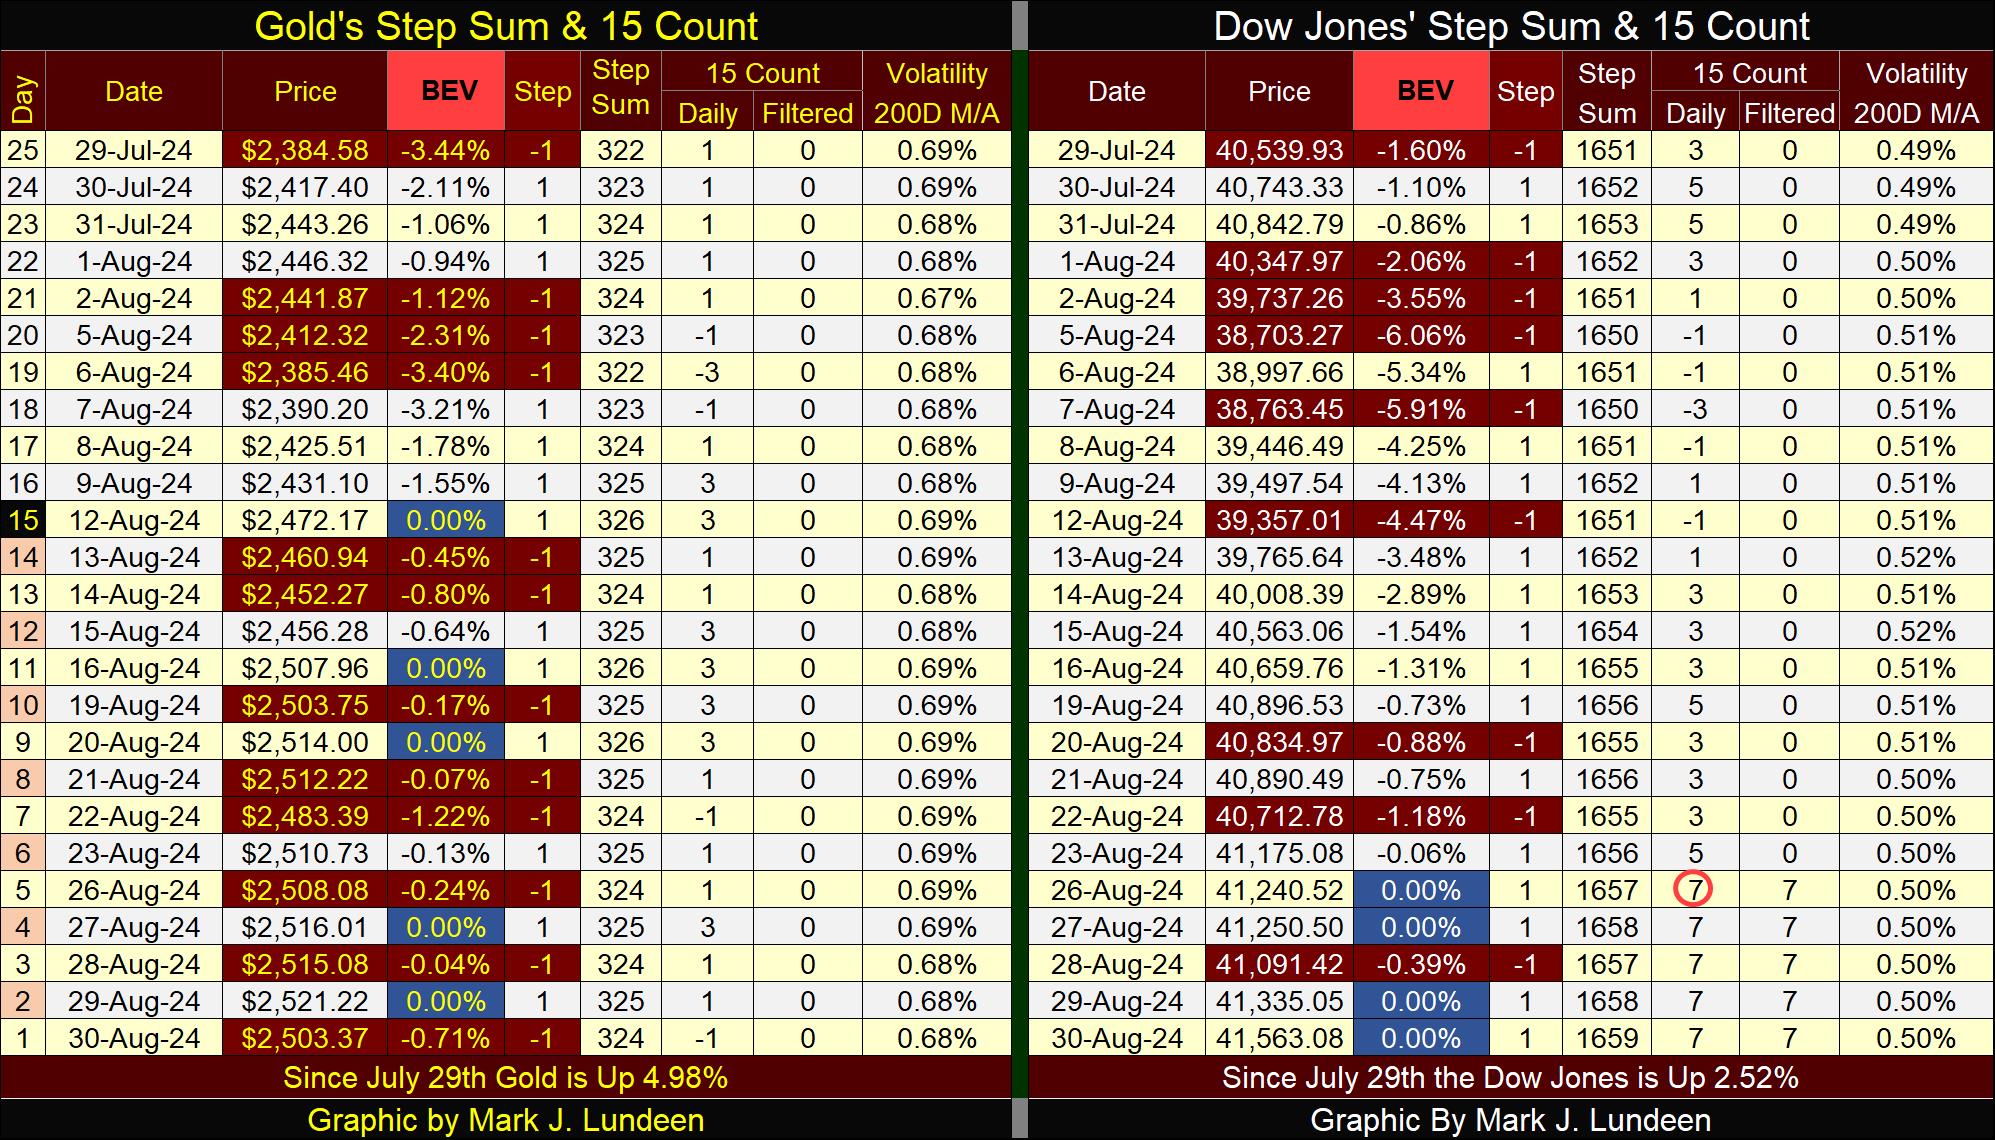
On the Dow Jones’ side of the step sum table, things are more normal; the Dow Jones is making new all-time highs during a period where advancing days are overwhelming its declining days.
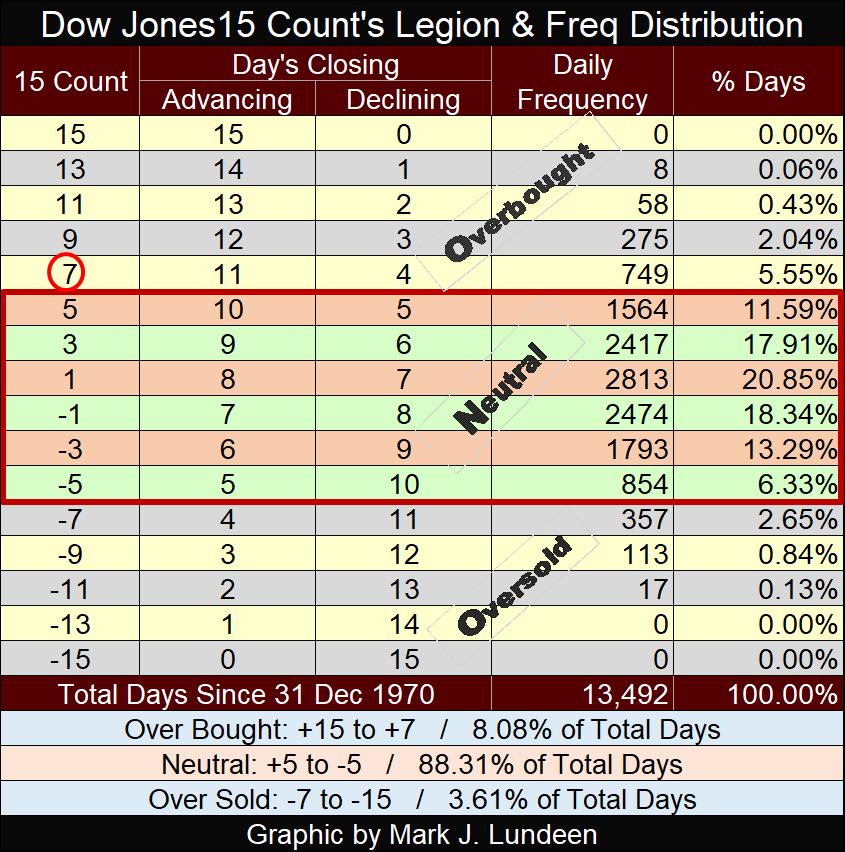
Closing the week with a 15-count of +7, tells us the Dow Jones is now overbought, as seen in the table below. If Monday, September 2nd is an up-day, the Dow Jones’ 15-count will become a +9, making the Dow Jones a very overbought market.
Markets don’t like being overbought, or very overbought, and tend to sell off from these high 15-counts to drive their 15-counts back to a neutral value.
As August 2024 comes to its end, it’s an exciting time for the bulls in both the stock market and precious metals. But these two markets are by nature countercyclical to each other, so this won’t go on forever.
Mark J. Lundeen
********
More from Gold-Eagle


