The 5 Most Important Gold Charts in 2025
Gold’s big breakout was last year.
It exploded through resistance at $2,100/oz, out of its super-bullish cup and handle pattern, and touched $2,800/oz.
The measured upside target remains $3,000/oz with a logarithmic target of $4,000/oz. The past cup and handle pattern breakouts I studied went from the measured upside target to the logarithmic target in six to 12 months.
But I digress.
2025 could be more significant because Gold and the precious metals sector is on the cusp of more meaningful breakouts in 2025.
First, is Gold and Silver against the total return of the 60/40 Portfolio.
Note that these ratios appear different because I have corrected the 60/40 Portfolio calculation to include rebalancing every December. Without annual rebalancing, the 60/40 Portfolio can, for example, become a 65/35 or 57/43 Portfolio.
Due to the weakness in bonds, Gold is close to breaking out of a 10-year range against the 60/40 Portfolio.
Silver remains contained within an 11-year base against the 60/40 Portfolio. It will not break out or come close until Gold breaks first.
Next is Gold against the S&P 500 (stock market), which has been locked in a range from 0.40 to 0.50 for nearly three years.
Gold cannot surge from its 10-year-long base against the 60/40 Portfolio without outperforming stocks. Surpassing 0.50 and sustaining it should set the stage for a major leg higher in the entire sector.
Gold needs to break out against the 60/40 Portfolio.
That means Gold needs to break out against the stock market, which means Gold needs to outperform the Mag 7.
The Mag 7 (Microsoft, Apple, Meta, Alphabet, Nvidia, Tesla, Amazon) gained an average of nearly 70% last year, driving the stock market higher.
We plot Gold against an ETF that tracks the Mag 7.
The ratio remains in a clear downtrend but bears watching. A rebound and stabilization near 60 could precede a Gold breakout against the S&P 500 and 60/40 Portfolio.
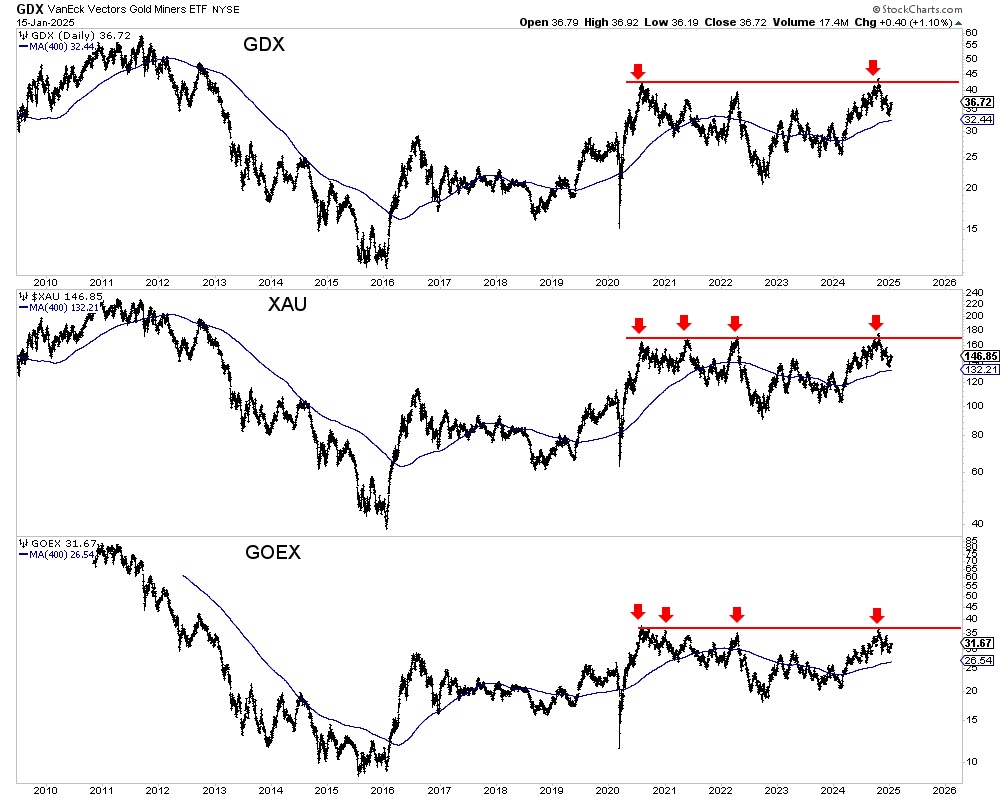
Lastly, various gold stock indices are consolidating within multi-year bases.
GDX, XAU, and GOEX (a fund of juniors similar to GDXJ) boast four-and-a-half-year bases.
There is potential for a breakout this year, which could unleash the best move to the upside since the recovery after the Covid crash.
Gold’s big breakout last year underwhelmed because Gold did not outperform in real terms. However, it may be a prelude to more significant breakouts this year.
Gold has a chance to break out against the 60/40 Portfolio and also the stock market. Should those breakouts occur, a breakout in the mining indices would follow. Then, Silver would come to center stage.
A stock market and economic downturn are the fundamental catalysts for these breakout moves, as they will lead to significant capital moving out of the Mag 7 and equities and into Gold.
In the meantime, one can position in quality junior companies that will lead the next move higher.
*********


