Active Trader Predicts Volatility (VIX) Spike And NASDAQ Selloff
A potential increase in risk may create massive opportunities for investors.
Throughout our ongoing analysis of the US markets, metals, energy and other market sectors, one thing we have seen over and over is that markets can, and often do, develop longer term trends than most people believe are possible or believable.
Recently, numerous analysts have been warning of potential “critical crashes” and “deep retracements” because of the fear that this rally is nearing some type of end cycle. We believe the charts tell the story of the investor sentiment and that, at some point in the future, these predictions may become true – but not today.
The VIX chart tells us quite a bit in terms of volatility, trend and potential market changes. One can see from this chart that the VIX has been trending within a “flag formation” that reaches a pinnacle in October 2017. This contracting flag formation is telling us that, unless the VIX breaks this range substantially, it should continue trading within this range for some time. At some point in the future, the VIX will break this flag channel and we could, then, see much more dramatic price volatility and corrections. But, until that time, contractions will continue to be muted in size and the bullish trend is likely to continue for a while.
Notice the averages are near the 12~13. There is a strong likelihood that the VIX could pop into and above these levels, briefly, through natural market contractions in the near future. By our analysis, roughly every 10~15 trading days (2~3 weeks) the VIX attempts to make some attempt at these levels from extreme lows.
I originally wrote this article on June 7th, but was not able to get it edited and posted until this weekend. See my statement below regarding when the VIX was set to spike:
This cycle indicates we should expect a VIX spike near June 9th or 12th and June 29th. Well, Friday the VIX spiked big as the NASDAQ crashed. In fact, I did take a net short position on the VIX as I expect stocks will continue their trend higher and thus the VIX will fade back down. I took this swing trade with my automated VIX trading system AT VIX
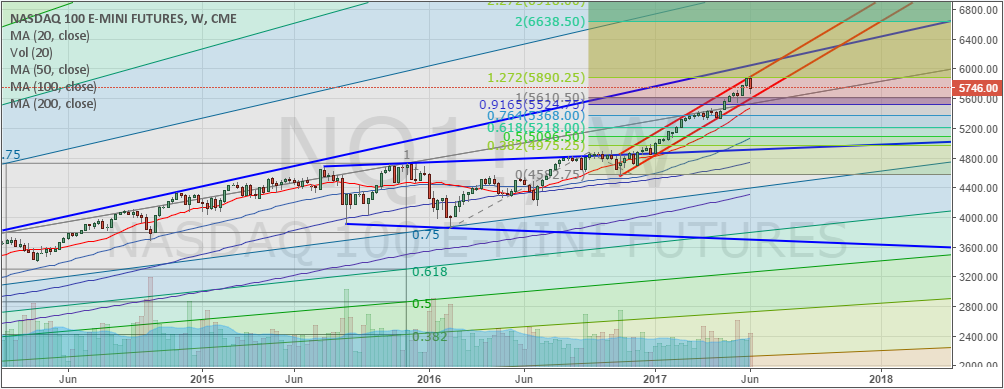
The NASDAQ has been the driving force in the US majors for quite some time and the chart of the NASDAQ below proves why. The Tech heavy NASDAQ has been driven to new highs on what we believe is a “capital migration” from local and foreign sources into the stability of the US markets. Almost like the Dot Com bubble, investors are piling into the tech stocks with the belief that these companies will continue to generate billions in revenues and branch out into other enterprises to drive innovation and growth. I talked about this last week “The Fourth Industrial Revolution, which will be referred to as: Tech Hypergrowth”
One point of interest is that we have recently reached a Fibonacci 1.272 expansion level that will likely prompt a bit of price consolidation/rotation. This level is substantial enough to prompt some level of concern for price rotation, but not enough concern (yet) to warrant panic. Remember, the VIX will tell us when to panic and that will be when it breaks the flag channel and the majors drive lower in correlation with the VIX.
This 1.272 level is cause for “tightening and revaluing open positions”. It means we should be aware that price may attempt a contraction period at this level before attempting to resume trending. One thing to always keep in mind is that price is always seeking new highs or new lows. One way or another, it will get to one of those objectives.
Additionally, the clear price channel (red levels) on the NASDAQ chart shows us normal price boundaries. A short period of price contraction here would, potentially, allow for resumption of the bullish trend and allow for an additional 2~4% bullish run.
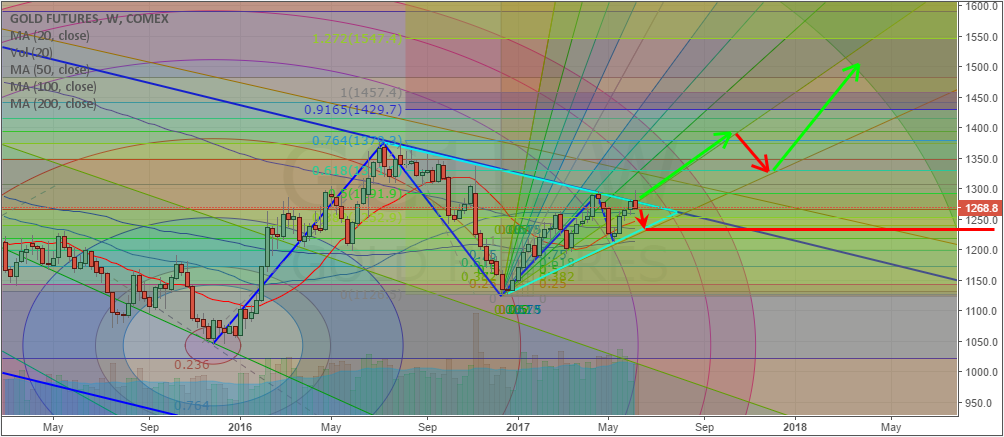
Metals are the other factors we pay close attention to in regards to trending, correlation to the majors - and to determine overall fear/greed factors within the markets. Pay close attention to gold and silver over the next few months. Gold has recently broken out of a SIX YEAR downward price channel temporarily last week and may attempt a move higher on global uncertainty. News from Europe, China and South America are concerning for the markets in general. Defaults, bankruptcies and “bail-ins” are the standard practice for these types of events. No reason to panic in regards to these events (yet) as they are fringe events – smaller, localized and isolated. Still, the metals markets will react to these concerns by factoring in the fear/greed levels globally.
Gold is also setting up a massive Flag Formation originating from December 2015. This formation tells us that potential upside targets, should a metals breakout/run happen, would be $1457, $1547 & $1788. We’ll keep you informed of opportunities as they play out with the metals.
Do you find this analysis helpful and insightful? Want more of it and my trades? Consider joining ActiveTradingPartners.com where our analysts and researchers are hard at work finding the best possible opportunities for you every day and deliver this high-quality research to your phone, PC/laptop or another device instantly. Our objective is to make you a better trader and help you become more successful – take a look at some of our recent trades.

The markets are complex and sometimes it helps to have a team of dedicated professionals providing you with opportunities and advanced research to assist in making better decisions. ActiveTradingPartners.com is that team and we welcome you to join our exclusive membership partners. Want to know when the next opportunity hits, our members will be alerted the instant we identify new opportunities for success – join www.ActiveTradingPartners.com today.
Chris Vermeulen


