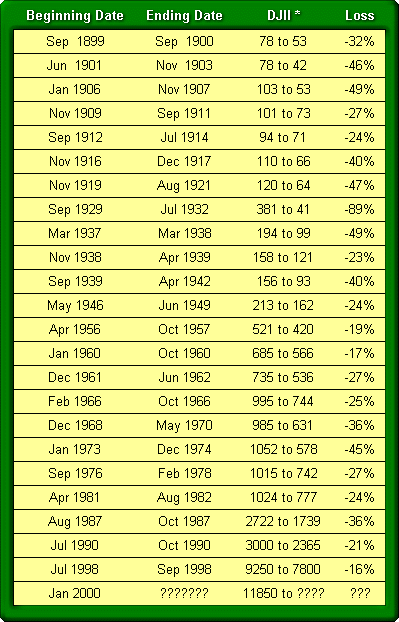
Bear Markets of the Past 100 Years

(*) Dow Jones Industrial Index
SUMMARY AND CONCLUSIONS
There have been 23 Bear Markets during the last 100 years. Bear Market declines ranged from -16% (1998) to -89% (1929-1932).
Consequently, if the current DJII Bear Market were to fall the average amount (34%), one would expect the DJII to find its nadir at about 7800. HOWEVER, since market excesses in the late 1990s approached those of 1929, we believe this Bear Market will be far worse than the 100 year average. The numbers suggest this Bear Market will be at least as bad as the 1973-1974 debacle (-45%), which translates to a Dow of 6500.
And if indeed the evolving Bear Market equals the 1973-1974 time length (23 months) , the DJII should reach bottom in January 2002. But then again, this secular Bear Market may well last a number of years longer in order to work off all the excess exuberance.
There is ample precedent for a protracted secular bear market. Recall the Dow first topped 1000 (intra-day) in 1966. And it languished there for the next 17 years (till 1982), when the Dow finally broke the shackles of the 1000 level. To be sure there is nothing on the economic horizon suggesting this Bear Market will be short-lived.
Following is a semi-log chart of Bear Markets during the last 100 years.

Note: Blue shaded areas are Bear Market periods
"The study of history,
while it does not endow with prophecy,
may indicate lines of probability."
John Steinbeck
vronsky
22 January 2001


