Bonds: The New Barbarous Relic
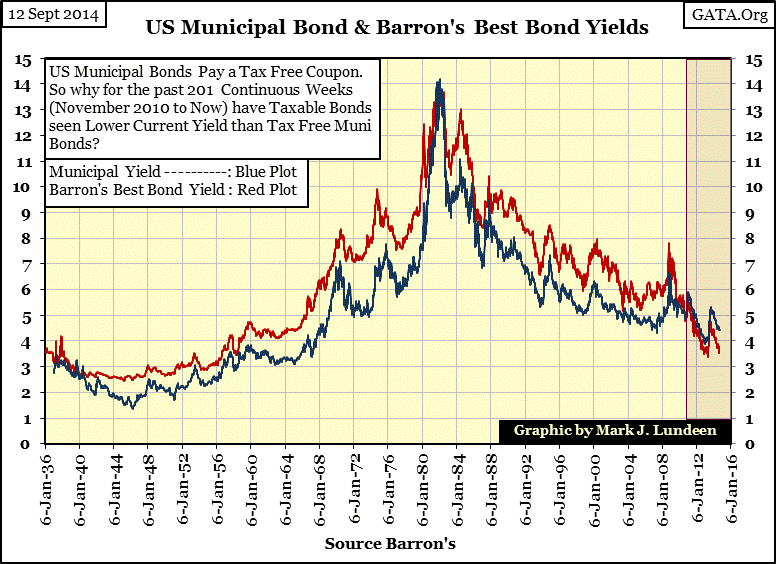
Historically tax-free municipal bonds (Blue Plot below) have yielded less than taxable best-grade corporate bonds (Red Plot). This has been true for two reasons:
- Their owners receive tax free income.
- State and local governments service their bonds via taxes.
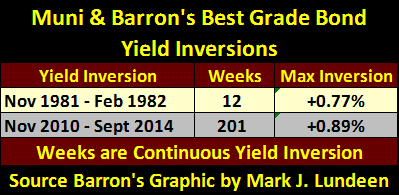
Though this is still true, muni-bond yields as published by Barron’s have been higher than yields for Barron’s Best Grade Bonds for 201 straight weeks (since November 2010, see red box in chart below). Although Barron’s has been publishing this data continuously since 1937, never in the past eight decades have the yields for tax free muni bonds been inverted for such an extended period.
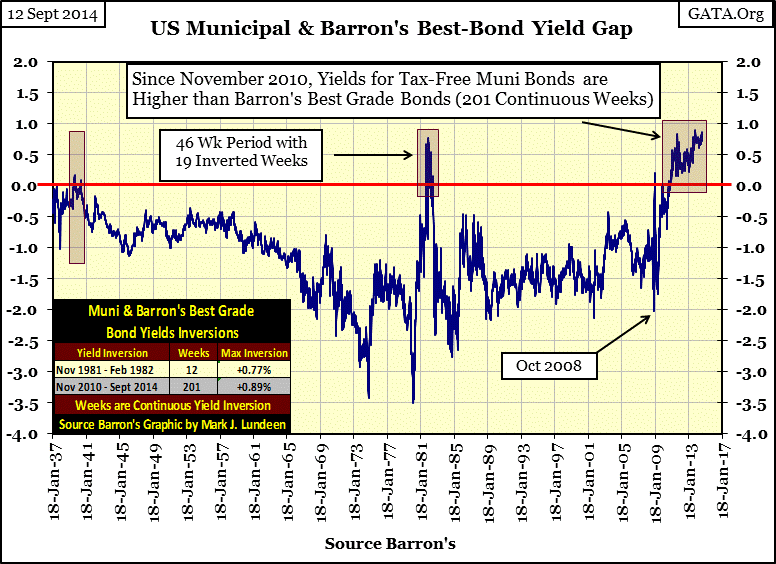
Below we see the credit spread between the two yields plotted above. Those periods when muni-bonds were yielding more than Barron’s Best Grade Bonds are shown as positive values and highlighted on the chart. This is known as a “yield inversion” but you never hear it discussed in the financial media. As the public today is mainly focused on the stock market this is understandable. But the bond market is important, and seeing such a prolonged inversion between tax-free muni and taxable corporate bonds is an omen of pending financial problems for local and state government.
Since January 1937 there have only been three periods when tax-free muni bonds were yielding more income to bond buyers than best-grade taxable corporate bonds, and all three times both state and local government finances were in distress. When one considers the advantages of tax-free income to people in higher income tax brackets, one must ask why wealthy people seeking income would prefer lower yielding taxable corporate to tax-free muni bonds? Ask the owners of Detroit’s muni bonds:
“(Reuters) - Detroit accounted for three of the seven defaults last year on municipal bonds rated by Moody's Investors Service, the credit rating agency said on Wednesday. Even before the cash-strapped city filed the largest municipal bankruptcy in U.S. history in July 2013, it began skipping payments on pension debt it deemed to be unsecured. Detroit subsequently missed payments on unlimited and limited-tax general obligation bonds it also labeled as unsecured debt.”
And it’s not just Detroit that is having difficulty making ends meet; states such as California, Illinois and numerous other municipal bond issuers have borrowed (and most likely squandered) more money in the bond market than their tax base can possibly repay in an economic downturn, or should unexpected events arise.
Barron’s data shows the first period of municipal bond stress occurred in 1939, when the Great Depression was stressing local government finances for the last time. Then during the first two years of the Reagan Administration, when Paul Volcker raised interest rates to historic levels, muni-bond yields once again exceeded the yields for best-grade corporate bonds. But back in the 1970s, some local governments were already having problems years before Volcker was Chairman of the Federal Reserve; for example New York City was facing bankruptcy in 1975. President Ford vowed not to bail New York City out in October 1975, but just one month later created a moral hazard when he changed his mind.

The current inversion of muni bond over corporate yields has been running for 201 consecutive weeks and counting. Since the Great Depression nothing like this has happened before; so what’s up?

Though the financial media has made little of this there are those who are now distancing themselves from the pending debacle in the muni-bond market. Ellen Brown’s “Web of Debt” blog recently posted an article titled Preparing To Asset-strip Local Government? The Fed’s Bizarre New Rules where she noted:
“In an inscrutable move that has alarmed state treasurers, the Federal Reserve, along with the Federal Deposit Insurance Corporation and the Office of the Comptroller of the Currency, just changed the liquidity requirements for the nation’s largest banks. Municipal bonds, long considered safe liquid investments, have been eliminated from the list of high-quality liquid collateral assets (HQLA). That means banks that are the largest holders of munis are liable to start dumping them in favor of the Treasuries and corporate bonds that do satisfy the requirement.”
I don’t know whether Ms. Brown is aware of the Barron’s data on Muni and Best Grade Bond yields above; but in effect she is predicting that the current yield inversion noted in the data will not only continue, but should expand as decisions by Federal banking authorities make the muni-bond market a lot less liquid. I’m not someone who is eager to defend our Federal banking authorities. In fact I believe they’re a bunch of sociopathic scoundrels. But Geeze Louise; many state and local governments have been dominated by the Democratic Party and labor unions for decades; their finances are a disgrace and reasonable people, (as well as sociopathic scoundrels) understand that the current situation in local government finance can only end badly for their creditors. Maybe this is why for the past four years bond investors have been sacrificing higher tax free income for lower yielding taxable bond income. Here is a short video on muni-bonds (The Bait in the Trap) by EWI.
http://www.youtube.com/watch?feature=player_embedded&v=iJNSiL56PtI
But today the corporate bond market is having problems of its own too. Below we see the Barron’s Best Grade Bond Yield (Blue Plot) and the Intermediate Grade Bond Yield, [from which Barron’s computes its Confidence Index (CI)]. Both bond series are considered investment grade, however as we see in the late 1930s and after the January 2000 high-tech bubble top, the bond market’s assessment of “investment grade” for intermediate grade bonds can change very quickly in times of market distress. This was painfully evident from September to December 2008 when Barron’s Intermediate Grade Bond Yield increased from 7% to over 15% in just a few weeks, halving the market value of these bonds during the sub-prime mortgage crisis.
Looking at the post high-tech bubble market in the chart above, it’s clearly evident that something fundamental changed in the corporate bond market after January 2000. Yes, the bull market in bonds that began in October 1981 may have continued, but the prospects for intermediate-grade investment bonds (as evaluated by the bond market ) are certainly not what they once were, as shown by the widening spread between best and intermediate grade bond yields.
Barron’s Confidence Index (CI), or the ratio of the two bond yields seen above is shown below. The CI is not a bond market timing tool. In fact the CI is a horrible tool for timing the bond market. So whether investors in these bonds actually realize an inflation adjusted profit from these companies’ bonds (debt) is something the CI can’t tell us. From 1951 to 1981 the US bond market endured a horrible bear market, yet little indication of these losses to bond investors can be seen in the CI. Then, from January 2000 to today, the bond market continued a bull market that had begun in 1981, while the CI was undergoing its largest decline since the Great Depression!
So what use is following the Barron’s Confidence Index? The CI provides us with the bond markets’ assessment of intermediate grade investment bond issuers’ ability to service their debts for the foreseeable future. And for good reason; since January 2000 the CI has been telling us that there is growing concern in the bond market that anything less than best grade bonds could possibly default.
In the chart above we’re looking at eighty years of bond market history, but the reasons why companies issue bonds today have changed greatly since 1934. Long ago bonds were issued for reasons of capital formation, to create a profitable infrastructure from which the company could provide goods and services to the economy for a profit to their share and bond holders alike. However, today elite companies such as IBM and Apple are issuing bonds to finance their share buyback program during a market top. In effect, many companies today are only increasing the debt load on their existing capital infrastructure to fund an unnatural demand for their shares in the stock market. Before Alan Greenspan became chairman of the Federal Reserve in 1987, swapping equity for debt was seen as reckless and ultimately unprofitable, so it rarely happened. But that was a long time ago.
In today’s world, even employees at a hamburger joint are college educated, so the world at large agrees with our new Federal Reserve Chairwoman, Janet Yellen, that assuming debt for the sake of assuming debt is an economic virtue. But if you believe what Barron’s CI is telling us, since January 2000 the bond market has had growing doubts that the less than best grade rated companies will ultimately be able to service their debts to term. Still, we live in a world where the greatest influence on any rate of return is central bank “policy” set by know-it-all academics controlling the global banking system via massive injections of monetary inflation into private banks. So what does that tell us about the bond market?
"Now that I am out of government, I can tell you what I really believe. Central banks are now so heavily influencing asset prices that investors are unable to ascertain market values. This influence is especially evident, with the Fed's purchase of government bonds, which has made it impossible for investors to use bond prices to learn anything about markets.
- Kevin M. Warsh: Former Federal Reserve Governor. Comments made to the Stanford University Institute for Economic Policy Research, 25 Jan 2012.
So in 2014, what does Barron’s Confidence Index actually tell us about the bond market? Mr. Warsh believes a lot less than it used to; and that central banks are intentionally driving bond prices higher and yields lower than natural demand would have them. I agree, and the problem of central bank interference in the bond market (stock market too) is global if we believe the Chief Economist at the Bank of England, its Executive Director of Monetary Analysis and Statistics: Andy Haldane.
“Let's be clear. We have intentionally blown the biggest government bond bubble in history. We need to be vigilant to the consequences of that bubble deflating more quickly than we might otherwise have wanted.”
- Andy Haldane, Bank of England
In 2014, TIME magazine voted Mr. Haldane one of the 100 most influential people in the world. Obviously the editorial staff at TIME are all college graduates. But Mr. Haldane’s comments were directed at the European sovereign debt market, for instance, Italian sovereign bonds. “The biggest government bond bubble in history?” Looking at the Italian sovereign bond below I wouldn’t care to argue it’s not.
Like the other EU Mediterranean nations, the Italian government made a mess of its economy by entering the European Union and then over issuing its sovereign debt in euros at lower interest rates than their old Italian lira bonds could ever command. This is widely known, yet Italian bond yields have fallen to historically low levels, even lower than similar US Treasury bonds because of central bank “policy.” And US Treasury debt, thanks to the Federal Reserve’s QE program is also mispriced! America’s national debt has increased by $12.3 trillion dollars (223%) since this bond was originally issued in 1997, yet its yield has fallen 400 basis points over the past seventeen years. Something is very wrong here.
Lord Keynes is still remembered for calling the gold standard a “barbarous relic” eighty years ago. I predict that within the next ten years his devotees staffing the global central bank fraternity will be exposed as the nincompoops who transformed the global bond market into a criminal enterprise which inflicted more damage to the world’s economy than did World War Two. And don’t expect them ever to admit that they are somehow responsible for the resulting deflationary disaster their “policies” caused; as “geniuses” don’t have to explain themselves to lessor beings like us.
So what can we do to limit the damage these idiot-savants are inflicting on our world? I still like Lord Keynes’ barbarous relic! In the chart below we see gold’s step sum is about ready to collapse (apparently), meaning more daily closes to the downside than up.
If it does collapse expect to see the price of gold follow its step sum down, but the worst of the price correction is already over. By Christmas I hope we’ll see the price of gold (and its step sum) bottom and reverse vigorously upward as the bull market in gold resumes. This is bound to happen sometime in the future – so why not in 2014?
Here’s silver’s step sum chart. Silver’s step sum is a long way from a proper collapse, but that is nothing new for silver. What’s new for silver this week is that
its price ended the week at a new low for the correction, but not by much.
Although that didn’t do much for my personal net-worth, I take comfort in knowing that silver is now that much closer to its ultimate bottom for the correction. Heck, mining companies can’t dig silver out of the ground for $18.60 an ounce, yet government regulators allow the big banks (who neither produce, fabricate nor consume silver) to sell tens-of-thousands of tons of digital silver below the cost of production in the futures markets. What kind of market price discovery is that? The same price discovery former Federal Reserve Governor Warsh and the Bank of England’s Andy Haldane described for the bond market above; market dictates by academic central bankers who are way over their heads. The global market place is a house of cards waiting to be blown down. Buying gold and silver at today’s subsidized low prices seems to be the way to go.


