first majestic silver

The Broad Market

Technical Analyst & Author
September 30, 2007

We now have an extraordinarily bullish setup for the broad stock market, which as we will soon see is considerably amplified by the latest Commitment of Traders data, that is unprecedented in the writer's experience, and startling.

On the 6-month chart for the S&P500 index we can see the powerful breakout from the Head-and-Shoulders bottom that occurred nearly 2 weeks ago. The day after this breakout the index continued higher, only to run into the underside of a wall of resistance approaching the highs. A bullish horizontal Flag has since formed that has allowed the market time to soak up the overhead resistance - the bullishness of the situation being confirmed by the volume dieback as the Flag has formed and the advance by the volume indicators, Accumulation-Distribution and On-balance Volume (shown at the top and bottom of the chart), to new highs.
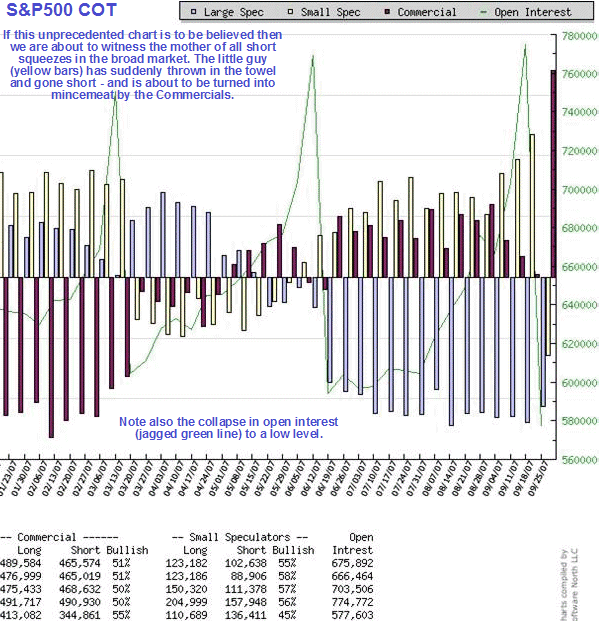
The latest COT data is startling, even to experienced market players, and, assuming that the data is to be trusted, suggests an extraordinarily bullish setup. According to this chart, Small Speculators have suddenly reversed position, going from being very bullish at the top of the breakout spike, to very bearish by the close of last Tuesday's trading, which is the point at which the latest data on this chart is taken. Although it has dropped, the Large Spec short positions remain at a high level, while the Commercials' long positions have rocketed in just one week. All of this points to "the mother of all short squeezes" driving a very powerful breakout to new highs - and soon. Remember the market doesn't need a great economy to go up, just unlimited liquidity - and the Fed has resoundingly demonstrated that they stand ready to provide it, no matter what the consequences.

Stock and option specific information follows for subscribers.


Clive Maund, Diploma Technical Analysis

[email protected]

www.clivemaund.com

Copiapo, Chile, 1 October 2007

Clive Maund

Clive P. Maund’s interest in markets started when, as an aimless youth searching for direction in his mid-20’s, he inherited some money. Unfortunately it was not enough to live a utopian lifestyle as a playboy or retire very young. Therefore on the advice of his brother, he bought a load of British Petroleum stock, which promptly went up 20% in the space of a few weeks. Clive sold them at the top…which really fired his imagination. The prospect of being able to buy securities and sell them later at a higher price, and make money for doing little or no work was most attractive – and so the quest began, especially as he had been further stoked up by watching from the sidelines with a mixture of fascination and envy as fortunes were made in the roaring gold and silver bull market of the late 70’s.

Clive furthered his education in Technical Analysis or charting by ordering various good books from the US and by applying what he learned at work on an everyday basis. He also obtained the UK Society of Technical Analysts’ Diploma.

The years following 2005 saw the boom phase of the Gold and Silver bull market, until they peaked in late 2011. While there is ongoing debate about whether that was the final high, it is not believed to be because of the continuing global debasement of fiat currency. The bear market since 2011 is viewed as being very similar to the 2-year reaction in the mid-70’s, which was preceded by a powerful advance and was followed by a gigantic parabolic price ramp. Moreover, Precious Metals should come back into their own when the various asset bubbles elsewhere burst, which looks set to happen anytime soon.

Visit Clive at his website: CliveMaund.com


India and the U.S. trump Italy as top gold jewelry exporters.
Top 5 Best Gold IRA Companies

Gold Eagle twitter                Like Gold Eagle on Facebook