Broad Market update - Too Many Dummies Are Getting Rich...
We know that the Fed and other Central Banks are printing money like there’s no tomorrow to stop the fragile system from imploding, but the Little Guy is not seeing any benefit from it, instead the banks and elites are making even more money out of that which is spirited into existence and then handed to them on a platter by driving asset prices higher and higher. The Little Guy instead gets stuck with the bill as he becomes a victim of the inflation that results.
There is a widespread assumption now that “nothing can go wrong”, because the Fed and other CB’s will simply print more and more money as required to keep the party going so that everything accelerates upward in a parabolic arc until the eventual and inevitable hyperinflationary burnout. This is true, that is where we are headed, but what is dangerous about the current situation is that this has become universally accepted and believed. This means that there could be some very nasty speedbumps along the way, particularly if the lurking forces of deflation temporarily gain the upper hand, as is happening right now in Europe, where the elites are using the state of crisis to consolidate power.
The cleansing forces of deflation should have been allowed to do their necessary work of purging debt from the system many years ago, but politicians didn’t want that – they wanted to keep the party going without a pause, and the result is now that these deflationary forces have built up to explosive proportions, and the only way to keep them at bay is by means of the most extreme money printing in the history of the world, which the crazy world of unbacked fiat money makes possible. They will succeed in keeping deflation at bay, but at a terrible price, with the resulting hyperinflationary depression being even worse than the deflationary implosion that they have worked so assiduously to avoid. Mike Maloney made the startling point in one of his Hidden Secrets of Money videos that more money is being created each year in the US, 1 trillion dollars, than in the entire history of the country up to the year 2007. It doesn’t take much intelligence to realize that the eventual consequences of this will be catastrophic.
So where are we now? With market players positively bursting with confidence, we are believed to be right at the point of hitting one of those nasty speed bumps, with a high probability that we will see a potentially vicious market plunge that will deliver a stunning right hook to a lot of traders that leaves them reeling, especially all the Johnny come latelies who have been vacuuming up all the recent bullish propaganda being pumped out by the mainstream media.
Let’s look at some cold hard facts now, using charts and sentiment indicators and studies from www.sentimentrader.com
The market is overbought, at a target, and looking vulnerable to a setback here, as made plain by the following charts.
On its 20-year chart we can see that the Dow Jones Industrials have arrived at a target at the top of a huge megaphone or bullhorn pattern, after a long bullmarket from the 2009 lows, and recent action has become choppy suggesting that it is topping out.

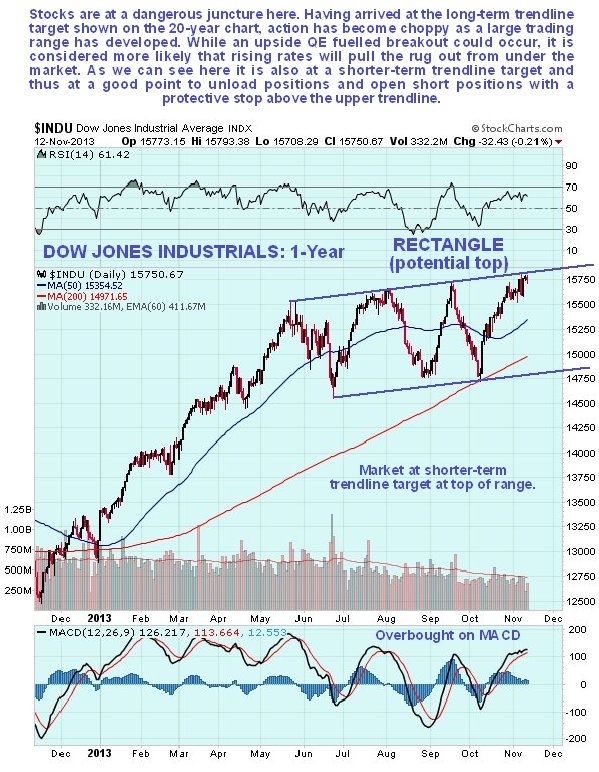
On the 1-year chart we can see the choppy toppy action and how the market has also arrived at a shorter-term trendline target – an excellent place for it to go into reverse.

Now let’s look at some other indications…
Dumb Money is raving bullish, which is by definition a reason to be cautious, since joining a flock of sheep is the surest way to get fleeced….

Chart courtesy of www.sentimentrader.com
The following more detailed chart showing Smart/Dumb money positions over time, enables you to compare these positions with market peaks and troughs…
Chart courtesy of www.sentimentrader.com
Next, newsletters, who as a group are wrong, have been raving bullish in the recent past too, as they serve to herd the sheep towards the fleecing shed. This is another negative.
Chart courtesy of www.sentimentrader.com
Next, everyone is getting so confident that they are not bothering to hedge, or protect themselves. This is another obvious danger sign. We can see from the following chart that such complacency is frequently a sign of a market top…
Chart courtesy of www.sentimentrader.com
Finally, the stock bond ratio is at a historic extreme. While this could be alleviated by bonds rallying a much more likely outcome is that instead stocks will fall. After all, there is little incentive to buy Treasuries, which are intrinsically worthless trash that have little upside potential, no yield, big risk to principal, and have the full backing and guarantee of a government that is bankrupt, and diluting the currency at breakneck speed. US Treasuries are an investment that is strictly for the lowest form of fool that you can find – an absolute moron. Thus we can expect this ratio to revert towards the mean as a result of stocks dropping back.
Chart courtesy of www.sentimentrader.com
Someone recently made the asinine remark that money flooding out of the bond market would pour into the stockmarket, driving it ever higher. That doesn’t look likely given that a falling bondmarket would drive interest rates sharply higher, creating an immediate debt servicing crisis.
So, although we are at a traditionally bullish time of year, when cash strapped consumers are encouraged to go even deeper into debt for a Christmas shopping binge, helping to drive the seasonal Santa Clause rally, it looks like the markets are going to go into reverse anyway – that’s what all the above charts and indicators are saying.


