A Bubble In Gold? Hardly…


Viewing the gold price in a vacuum, some may think there is a bubble in gold, but that is far from the case.
The gold price is, after all, doing this…
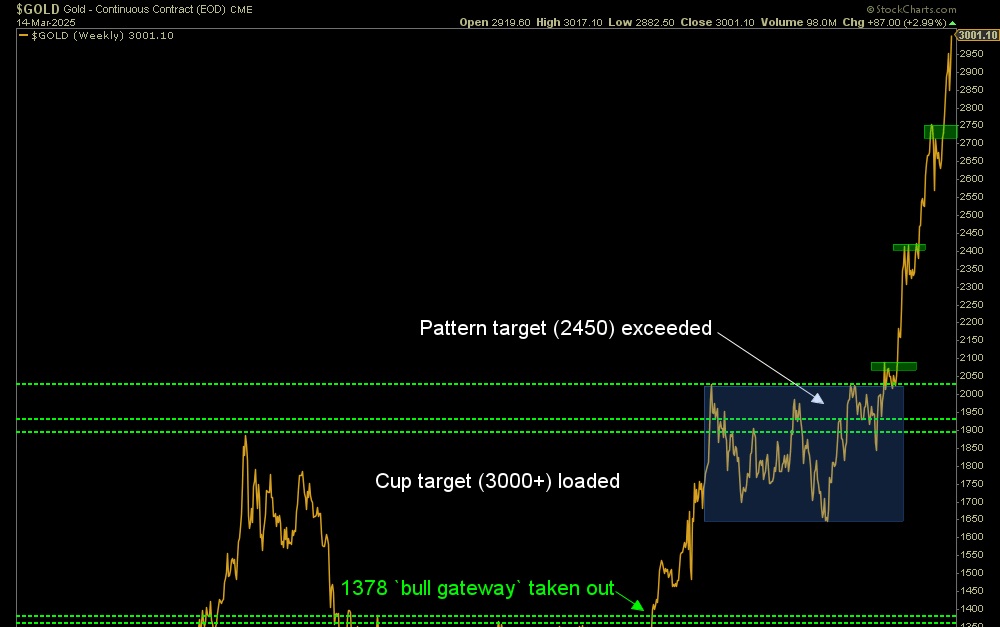
Just last week the gold price ticked our target of 3000+, which was established in 2020 as gold topped out and began its handle-making phase and pattern consolidation, after making a higher right side high to its massive and bullish Cup pattern.
Is this round number target (it was actually the Cup’s measurement) a stop sign? Maybe, for a while. Maybe not. Targets are objectives, not earth shattering conclusions, and bull markets do not go straight up.
Aside from gold’s nominal price, I have frequently presented this chart of the gold price relative to the S&P 500. This shows who has really been the recipient of official (Fed and government) inflationary policies since 2011, and who has not.
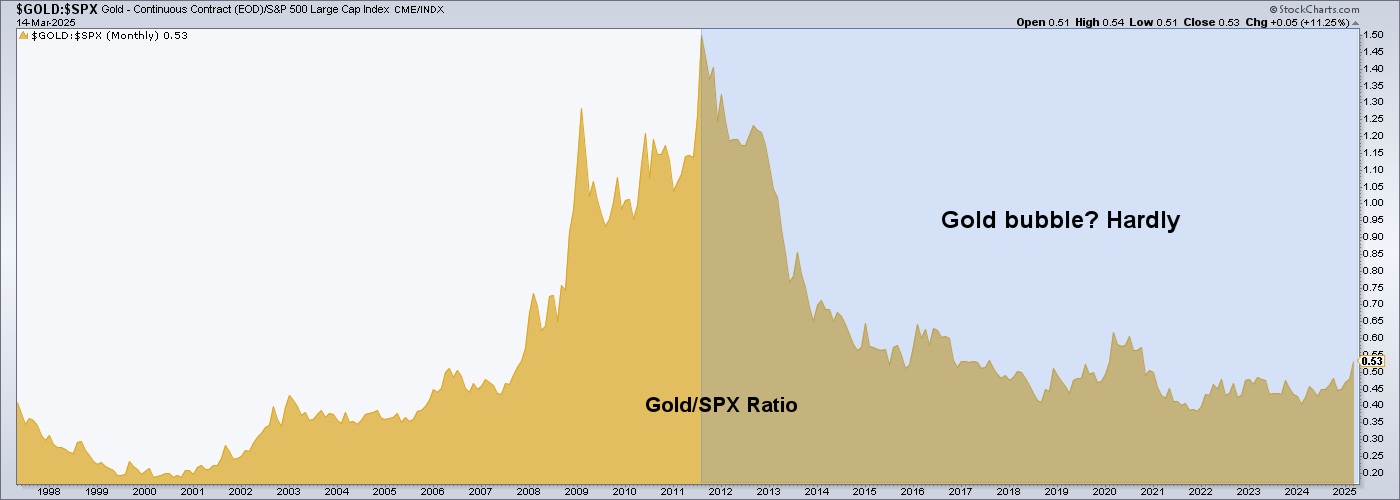
But in looking through nftrh.com’s extensive Links page, I reacquainted myself with Macrotrends, a helpful website that holds a lot of ratio charts of various markets. It’s a nice visual nerd fest. Below is one that goes well with my assertion in the chart above.
A bubble in gold? Hardly, as compared to the bubble in Monetary Base, which is a way of saying the bubble in monetary policy. I have been assigning the real bubble dynamics to monetary and fiscal policy, with the stock market simply being bubble beneficiary #1. Gold, on the other hand… Palookaville.
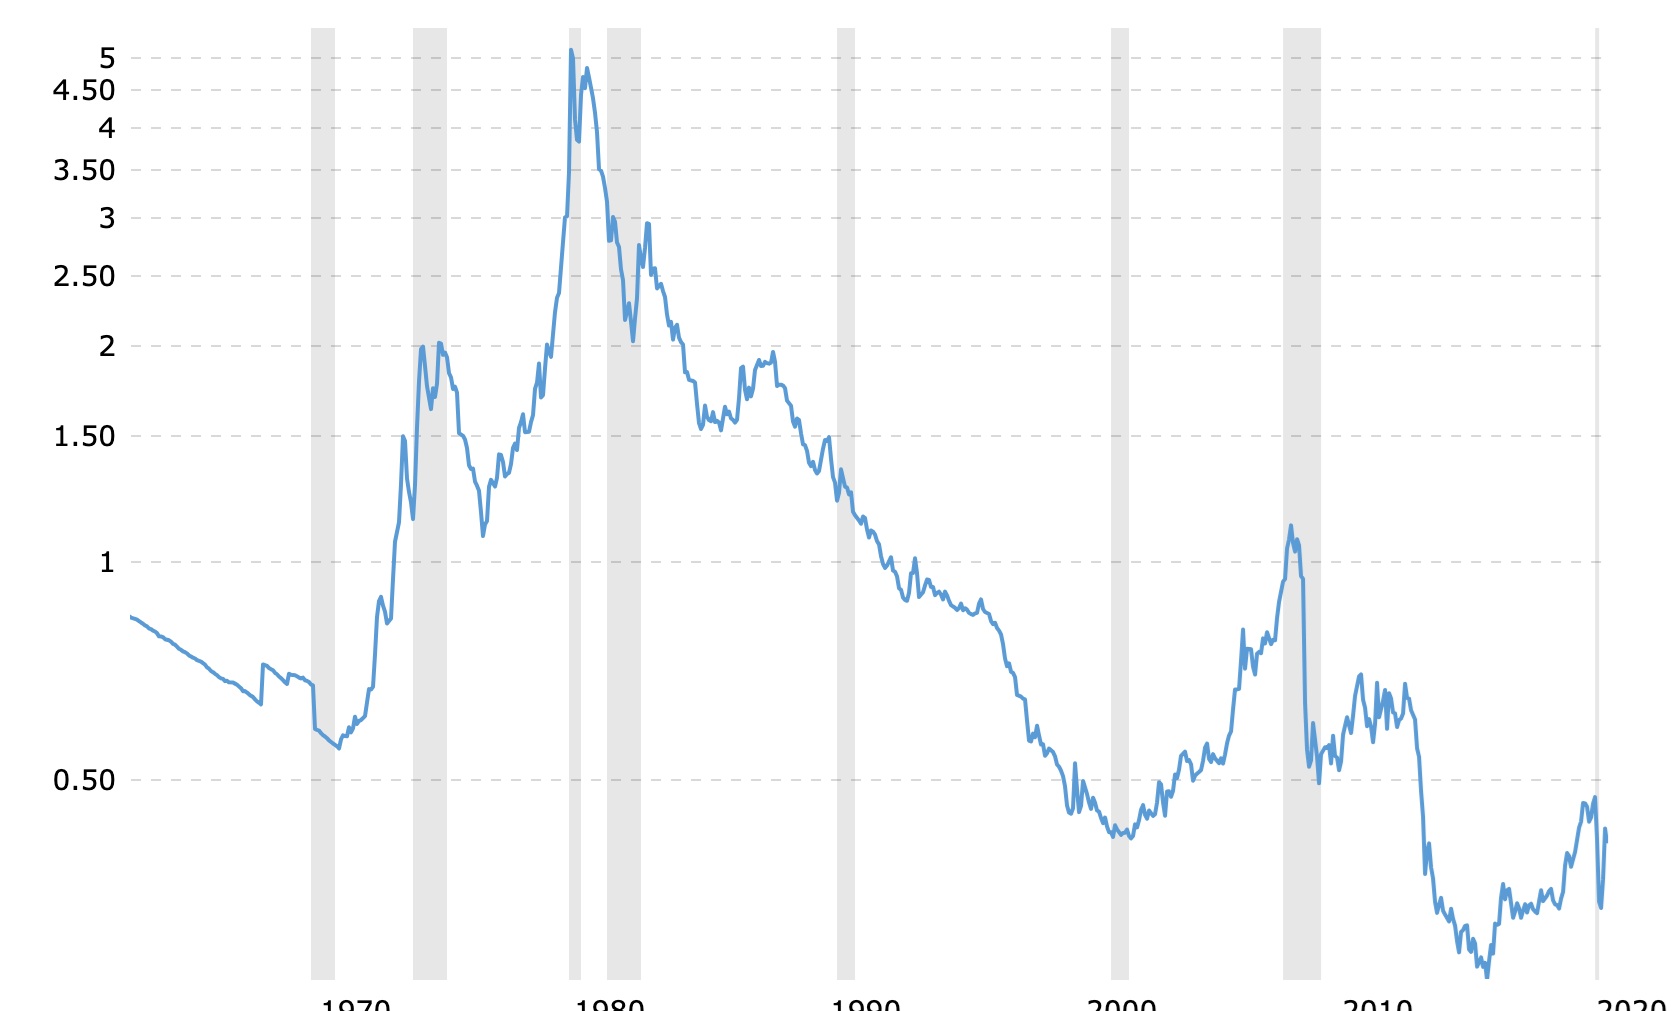
Here is how Macrotrends describes the ratio.

Aside from making my long-standing point that gold is not primarily about inflation (as they’ve chronically inflated money supplies for decades), the chart tells us that the current bull market in gold is only just getting started.
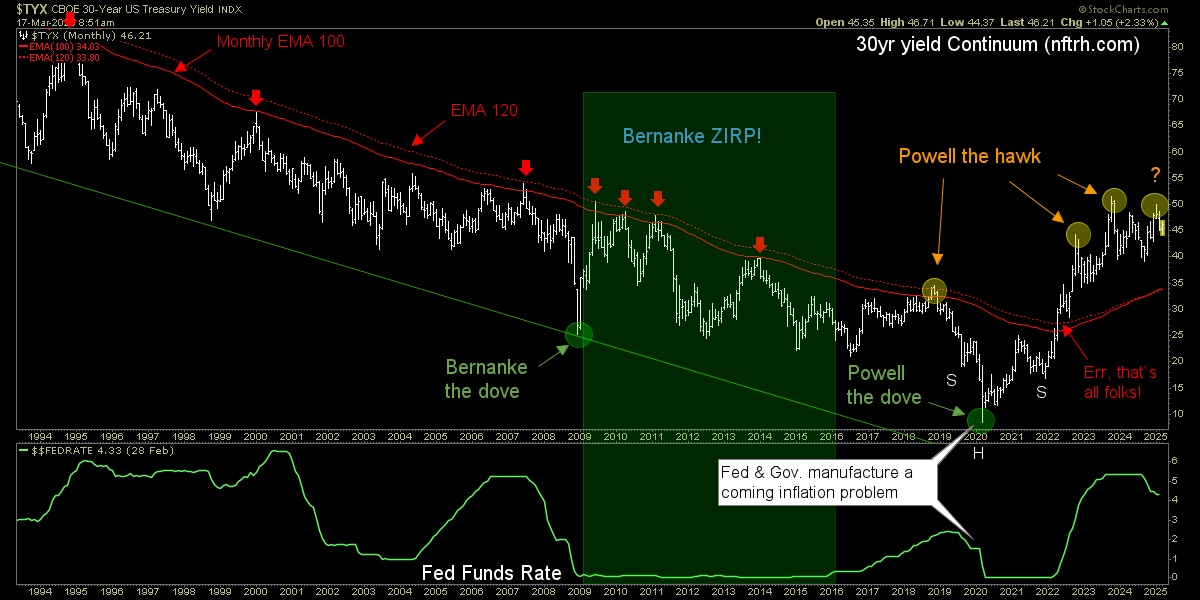
My assertion is that the break in the Continuum’s decades-long disinflationary downtrend * is indicative of policymaking that will be handcuffed relative to recent decades, in its ability to rescue asset markets in “business as usual” fashion.
It is not hard to imagine that the nominal gold price could move significantly higher, even if the Gold/Monetary Base chart above gets nowhere near the 4.8 level noted by Macrotrends.
* Which gave license to ongoing and chronic inflationary policies by Fed and government.
For “best of breed” top down analysis of all major markets, subscribe to NFTRH Premium, which includes an in-depth weekly market report, detailed market updates and NFTRH+ dynamic updates and chart/trade setup ideas. You can easily subscribe by Credit Card or PayPal (see all info and options).
Keep up to date with actionable public content at NFTRH.com by using the email form on the right sidebar, or take it to another (intermediate) level with our free eLetter. Follow via X @NFTRHgt. Also, a new tier of service is coming soon, as NFTRH++ will offer technical trading signals. More info on NFTRH++ here.
********


