Chart Symmetry
DeBeers; Daily POG; Dow Utilities; Randgold
Chart Symmetry is designed around the observation that prices tend to change direction along certain preferred gradients. Different preferred gradients are linked though the Fibonacci ratio. When a preferred gradient has been identified and confirmed, it and its derived gradients can be used to search for patterns that help to describe the shape of the chart, which then enable the analyst to anticipate certain developments.
The prices shown for the lines are the values of the lines at the next time interval after the chart close. It is not a prediction that the price will suddenly move to reach that line overnight, but provides the reader a measure of the move that could take place if the price pattern does develop in the direction of that trend line. The steeper the line, the greater will be the change in the line value over time.
The key point to remember throughout is that the gradients of all secondary lines were derived from the gradient of the master line. There is thus limited ability for the analyst to 'do his own thing' and develop a pattern that fits his preconceptions. The patterns that are shown in the analyses are inherent in the charts, but these are not the only patterns that can be derived.
De Beers in US currency – calculated from JSE close.
Daily close. (Last = $20.75)

The chart shows the same bear channel used some weeks ago. Line I, with a gradient that is the direct inverse of that of line M, has been added. Note that the spacing of the bear channels is quite regular – a common feature of preferred gradients.
Scenario 1: The price breaks below resistance at line I and begins a bearish correction, back down to support at line B.
Scenario 2: The rising trend continues, perhaps after a goodbye kiss on line I, until strong resistance at the top of the channel at line A is reached.
Preference: Turnover in DeBeers last week (on the JSE) showed a consistent increase, and with the rising price it reveals substantial demand and eager buyers. A reversal in the price trend now – to below support at line I – would be an indication that supply is beginning to exceed demand, which would be a warning signal that the current run has reached its limit.
For the time being, after the break above line I, Scenario 2.
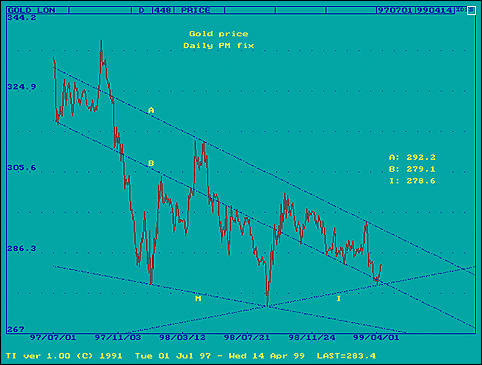
Gold: Daily PM fix. (Last = $283.40)
On its weekly chart, shown here the past few weeks, gold is facing resistance at $280.25 from the top boundary of the steep bear channel and then perhaps even more important longer term resistance at $295.80. A PM fix above the steep channel this Friday (16th April) will be positive, but at time of writing the $295.80 level seems a bit out of reach. However, miracles . . . .
The chart shown today is the daily PM fix. The main feature is support from line I, the direct inverse of the master line, M. When the support line of a bear trend is inverted at the low on the chart and the new line then acts as support for the rising trend, it is known as 'inverse symmetry'. Inverse symmetry occurs quite often and the inverse line is usually quite significant support. ( We see this also on the weekly chart shown last week.)
POG is on leg 5 of the wedge formation A-M. In principle this should be followed by a break below the wedge at line M. There is also a triangle, A-I, with gold on the rising leg 4, with line A as target. The two patterns are in conflict at the moment, with the triangle dominant for the time being.
Scenario 1: After forming a bottom below line B and rebounding off support at I, gold continues higher to reach resistance at line A, where leg 4 of the triangle completes.
Scenario 2: Gold fails to maintain the rising trend and reverses direction to test support at line I again, breaking lower to extend leg 5 of the wedge pattern.

Preference: The time of risk for Scenario 2 is the cross-over of B and I, due around Wednesday, April 20th. Prices are often attracted to a cross-over, to be followed either by a steep reversal out of the cross-over or a sustained break, which would be bearish in this case and probably have line M as target.
On the basis that leg 4 of the triangle is well under way, however, a move higher to test resistance at line A is seen as the more likely development. Scenario 1 is preferred.
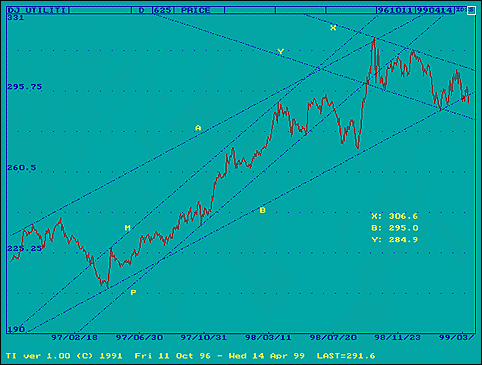
Dow Jones Utilities Index. (Last = 291.6)
Vronsky, in his article of April 8, "Dow Utilities Lead Stocks", https://www.gold-eagle.com/gold digest 99/vronsky040799.html discussed the leader role played by the Dow Utilities Index. A chart of the Index showed that it was toying with support at the 200 day moving average. Here is a Chart Symmetry analysis of the Index showing that it has just repeated a break through 2-year support.
The master line is the resistance line of the 1997-98 bull market in the Index, which took place mostly in channel M-P. After the collapse of August-September 1998, the Index recovered within channel M-P, but only made it to the top of the shallower derived channel, A-B before reversing again. The new bear trend settled in the next shallower channel, X-Y. (As usual, all the lines were derived from the gradient of M).
The first break below support at line B recovered quickly enough, but on Thursday (14 April) the Index broke lower again.
Scenario 1: The Index again recovers into channel A-B and remains bullish, with resistance at X as target.

Scenario 2: The Index moves lower to test support at the bottom of channel X-Y.
Preference: The new break below support at line B is likely to be better sustained than the first. Scenario 2.
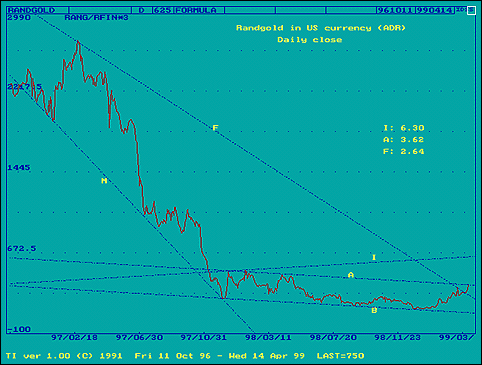
Randgold. Calculated in US currency from JSE close. (Last = $3.70)
The daily chart of the dollar (ADR) price of Randgold clearly shows the recent break through line F – upper boundary of the major megaphone formation, M-F.
The price closed on Thursday (14th April) a fraction above resistance at the top of the shallow bear channel, A-B. The gradient of this channel was also derived from M. Line I is the inverse of line B, which makes I-B a symmetrical megaphone..

Scenario 1: Resistance at line A holds, despite the marginal break higher. The price returns to line F for a goodbye kiss (much the same as was done by Durban Roodepoort Deep under similar circumstances, as shown in the analysis of last week.)
Scenario 2: The price extends the break above resistance at line A, on its way to line I.
Preference: A goodbye kiss on A, at $3.62 on the chart ($3 5/8), followed by a move higher to test resistance at line I is perhaps the more likely development. However, a goodbye kiss on F (a là DRD), before the price rises again, cannot be excluded. The next day or two should provide clarity.
Comments on previous charts:
Durban Roodepoort Deep is still trapped between steeply descending support at $2.01 and horizontal resistance at $2.39. A break above the resistance is needed to begin what will probably be a steep rising trend after the break from the megaphone..
US 30 year Treasury Bond: The key market support level is at about 5.61%. A break higher will be bearish..


