Do Gold Stocks Have An Excuse To Rally?
Summary
-
Gold remains subject to the immediate pressure of a strong dollar.
-
However, select gold mining stocks are starting to show promise.
-
Increased mining stock strength could lead a gold rally in June.
While gold’s immediate trend remains uncertain in the face of U.S. dollar strength, the metal does have at least one important ally: the gold stocks. As I’ll argue here, recent internal improvements among several actively traded mining shares could serve to stimulate short-term demand for gold. In today’s report, we’ll look at the internal momentum structure for gold stocks and see how much rally potential exists for the XAU index in June. We’ll also discuss gold’s immediate-term technical position.
Gold prices were slightly lower last Thursday despite a weakening of the U.S. dollar. Spot gold was flat at $1,300 and finished the month of May with a 1 percent decline, its second consecutive monthly decline. June gold futures were $3.50, or 0.27 percent, lower for the day.
Safe haven interest in gold was diminished on Thursday after the easing of political tensions in Italy. Meanwhile, gold traders are also mulling over the implication of an announced trade plan from Washington which would put tariffs on steel and aluminum imports from the European Union. The EU responded that it wants to avoid a trade war but would retaliate if the U.S. imposes tariffs.
News headlines aside, gold’s immediate-term (1-4 week) outlook hangs in the balance with the U.S. dollar index (DXY) serving as the proverbial Sword of Damocles over its head. A weakening of the dollar index, with DXY closing under its 15-day moving average, is needed to lift the immediate pressure from gold. As I’ve argued in recent reports, a close under the 15-day MA in the dollar index (below) would serve as the ideal catalyst for a technical rally in the gold price. As the following graph shows, DXY closed barely above its 15-day MA on Thursday and could easily slip below this trend line at any time in the next few days.
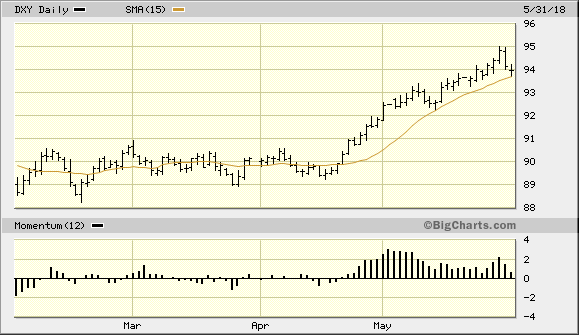
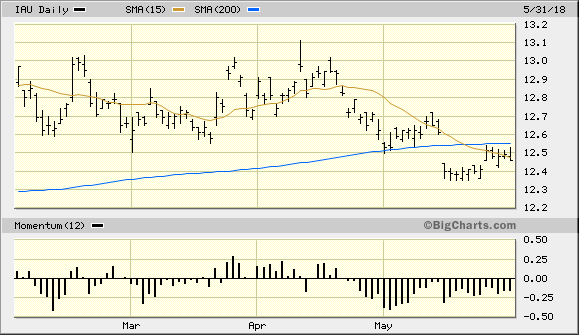
A close under the 15-day moving average for the dollar index would serve as an immediate relief for gold, which is in dire need of help in getting above its 15-day moving average. Of more critical importance, however, is the need for the gold price to recover above its widely followed 200-day moving average. The longer gold remains under this psychological benchmark, the more traders will begin to question gold’s intermediate-term prospects even in the face of geopolitical concerns and other stimulants of safe haven demand.
Shown below is the daily graph of the iShares Gold Trust (IAU), which still hasn’t managed to recover above its 15-day MA as of May 31. IAU is also still under its own 200-day moving average (blue line) and still must close at least two days decisively above its 15-day MA to let us know its immediate-term downtrend has been formally broken.
Source: BigCharts
A reversal of the stubborn strength of the U.S. dollar isn’t the only thing which could bring relief for gold, however. As I argued in my previous commentaries, the actively traded gold mining shares have historically served as one of the most important leading indicators for the gold price. At times, the gold price has even been highly sensitive to leadership in the PHLX Gold/Silver Index (XAU) when the dollar was fairly strong. For that reason, if there is increasing strength in the gold stocks in early June, it will greatly increase gold’s chances for a late-spring turnaround.
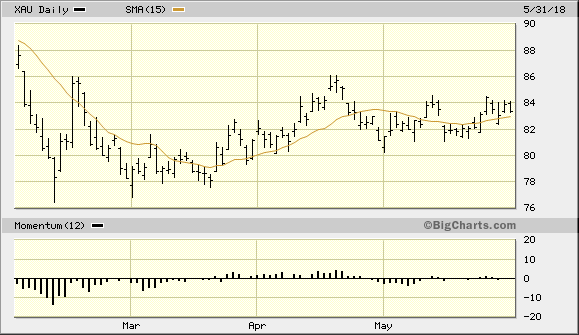
This brings us to the short-term outlook for the mining stocks. The actively-traded gold and silver stocks found support on Thursday above the 15-day moving average as the XAU daily chart shown here testifies. This is one sign that the gold stock bulls still have an interest in keeping prices above the lows from early May.
Source: BigCharts
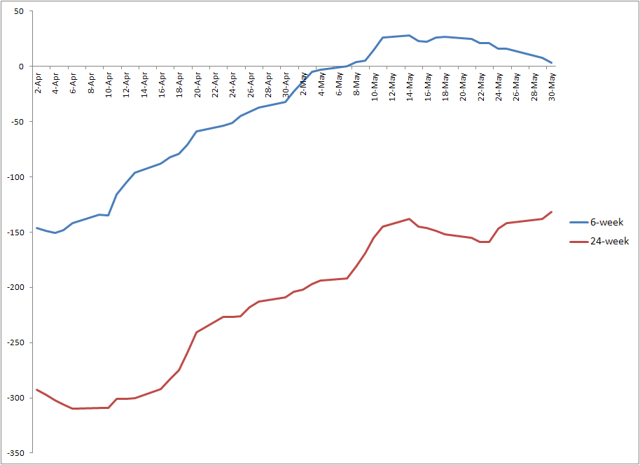
Internally, the gold stocks are at cross currents. Gold stock prices are caught between two major internal momentum currents – one of them rising while the other drifts lower. Shown below is a graph of the 6-week and 24-week rate of change for the new highs and lows of the 50 most actively traded gold mining stocks. The 24-week line (red) I consider to be the dominant intermediate-term momentum indicator for the gold stocks is in a sustained upward trend, as you can see here. The 6-week (blue line) momentum indicator is falling, however, which has created a bit of a headwind for the mining stocks but hasn’t completely canceled out the upward force of the intermediate-term indicator.
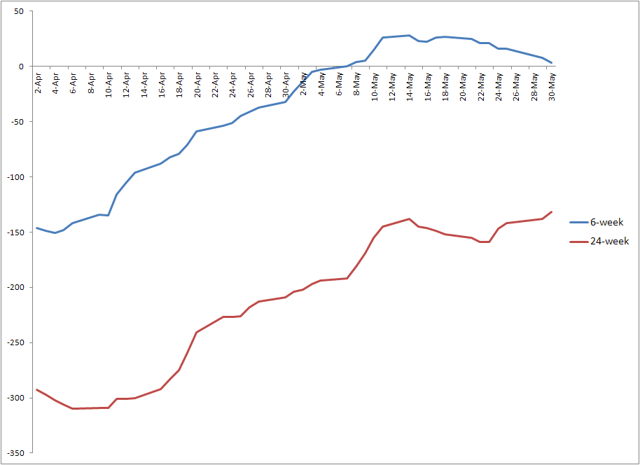
Whenever the two important components of gold stock internal momentum shown above are at odds, a trading range is the usual outcome for the XAU index, which has indeed been the case of late. As the 24-week rate of change indicator is the more important of the two lines shown above, however, the fact that it’s rising is a plus for the gold stocks and should give the bulls a slight advantage heading into June.
********
Disclosure: I/we have no positions in any stocks mentioned, and no plans to initiate any positions within the next 72 hours.
I wrote this article myself, and it expresses my own opinions. I am not receiving compensation for it (other than from Seeking Alpha). I have no business relationship with any company whose stock is mentioned in this article.
Source: WSJ
Whenever the two important components of gold stock internal momentum shown above are at odds, a trading range is the usual outcome for the XAU index, which has indeed been the case of late. As the 24-week rate of change indicator is the more important of the two lines shown above, however, the fact that it’s rising is a plus for the gold stocks and should give the bulls a slight advantage heading into June.
As the XAU chart shows, the upper boundary of the XAU’s short-term trading range to date has been around the 86.00 level, which is an important interim chart resistance for the index. If nothing else, a move to this level would almost assuredly pave the way for an important rally in the price of gold.
The question is whether there is any internal excuse for the gold stocks to push higher in the days immediately ahead and possibly allow for a breakout above the 86.00 level upper trading range boundary in the XAU. If both the short-term and intermediate-term momentum indicators were rising simultaneously, the answer to this question would be a resounding “yes.” Unfortunately that isn’t the case, but there is at least one indicator in the momentum series that could allow the gold stocks to make a breakout attempt. The intermediate-term indicator for the gold stocks could suffice to accomplish this at some point next month. In the meantime, traders should focus most of their attention on building a watch list of individual mining shares which show conspicuous relative price strength and forward momentum. Recent examples of this include Goldcorp (GG), IAMGOLD (IAG), and Gold Resource Corp (GORO).
On a strategic note, we’re still in a cash position after the May 15 decline and are still waiting for the selling pressure to end after gold’s latest setback. I recommend that investors continue to remain in cash and avoid the temptation to catch the proverbial “falling dagger” since the gold price can always go lower before hitting a completely sold out technical condition. We need to see a simple 1-day close below the 15-day moving average in the dollar index (DXY) shown above, as well as additional evidence of a bottom in IAU as mentioned above. Accordingly, no new trading positions in the gold ETF (NYSEARCA:IAU
*********
Disclosure: I/we have no positions in any stocks mentioned, and no plans to initiate any positions within the next 72 hours.
I wrote this article myself, and it expresses my own opinions. I am not receiving compensation for it (other than from Seeking Alpha). I have no business relationship with any company whose stock is mentioned in this article.


