Further Gains for the Dow Jones and Gold are Anticipated


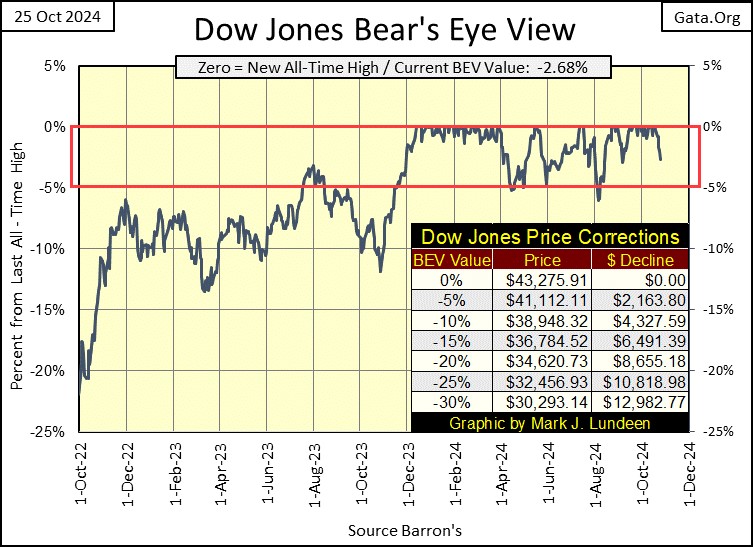
The Dow Jones this week, closed lower in each trading session, resulting in a 2.68% decline for the Dow Jones from its last all-time high of Friday last week. Let’s look at this; five consecutive down days for the Dow Jones, resulting in a 2.68% decline. That isn’t bad. Also, that leaves the Dow Jones in scoring position at the close of this week, where it has been since last November, except for a few bad days this summer.
The question in my mind is; is this selling completed, or after eleven months, will continued selling finally drive the Dow Jones out of scoring position, and then down to levels, not currently considered possible by “market experts?”
It might, but with the Dow Jones now with a BEV of -2.68%, eleven months into scoring position, why spoil the party by thinking negatively. Sure, this party is going to stop someday, but I’m going to enjoy it while it lasts. This week, the Dow Jones closed in scoring position (BEV between -0.01% and -4.99%), so I’m going to figure it’s good for more new all-time highs in the weeks and months to come. Gee guys, let’s keep this as simple as possible.
I was curious, so I did a BEV plot of the 1920s bull market, the big Roaring 20s Bull Market just before the Great Depression Market Crash. It looks much the same as our BEV chart for the Dow Jones above, except the Dow Jones remained in scoring position for about five years in the 1920s. I doubt the Dow Jones in the 2020s will remain in scoring position for five years. Also interestingly, scoring position for the 1920s was between the Dow Jones’ BEV 0% and -10% lines.
Today, one hundred years later, I’m telling my readers to get the hell out of Dodge City should the Dow Jones break below its BEV -10% line. But as seen below, in the 1920s, a 10% correction from a new all-time high was only to be expected, not a reason to exit the market.
So, why would that be? It’s as I’ve said before; about the time you think you understand the rules in the market – someone goes and changes them, as seen in these two BEV charts.
Now look what happened in September 1929, when the Dow Jones broke below its BEV -15% line; the Great Depression Market Crash. A century later, will our current BEV -10% line provide the same early warning to the bulls? I’m hoping it will, because the bear market that follows this bull market, should be historic.
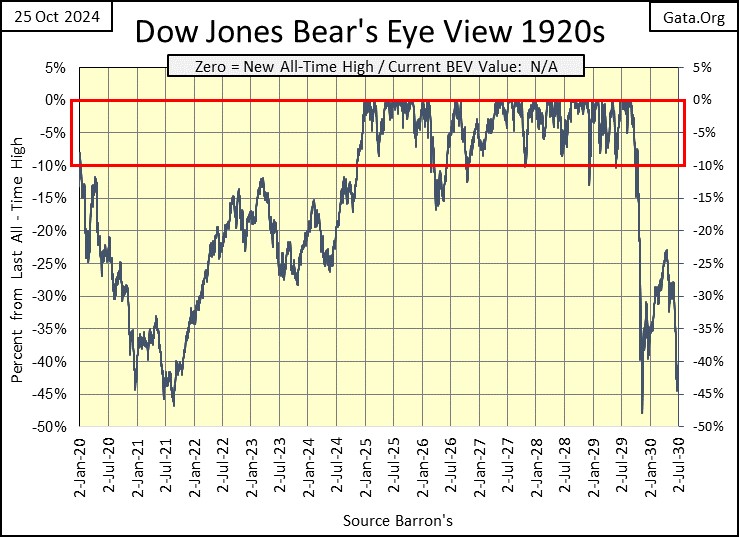
Maybe yes, and then maybe no, on this impending doom on Wall Street. What is interesting when comparing these two BEV charts of the Dow Jones, separated by a century is; the current scoring position is between the BEV 0% and -5% lines, when in the 1920s it was between the BEV 0% and -10% lines.
If I were forced to be specific, state exactly why I believe scoring position between the 1920s and the 2020s is so different, I’d have to guess, it was because the financial markets in the 1920s were almost free from government regulation.
When the Dow Jones broke below its BEV -45% line in October 1929 in the chart above, there were no urgent phone calls coming from Washington’s “regulators” to Wall Street’s officials, demanding to know “what is going on at the NYSE.” Because in 1929, Wall Street’s “regulators” did not yet exist, that would have to wait until 1933, when President Roosevelt had the SEC legislated in to reality.
Today, can the Dow Jones break below its BEV -10% line, without someone highly placed on Wall Street, having to answer questions from a Washington bureaucrat, why did they allow the Dow Jones to correct 10% during an election year, and having an answer how they plan to prevent this from happening the next time? Maybe not, but I’d be surprised it this didn’t happen a few times a year.
Moving on to the Dow Jones in daily bars below, this week was a down week for the Dow Jones. It moved halfway towards its BEV -5% line in only five days. But this is how markets advance; two steps up / then one step down. I’m thinking this was one of those one-step down weeks. There may be more selling next week, but as the Dow Jones approaches its BEV -5% line in the chart below, resistance to the downside is going to stiffen, and we’ll soon see the Dow Jones making new all-time highs.
If this advance is going to continue, that is how this must be, until Mr Bear arrives on the scene. At which point, anyone who exits the market when the Dow Jones closes below its BEV -10% line will be happy they did.
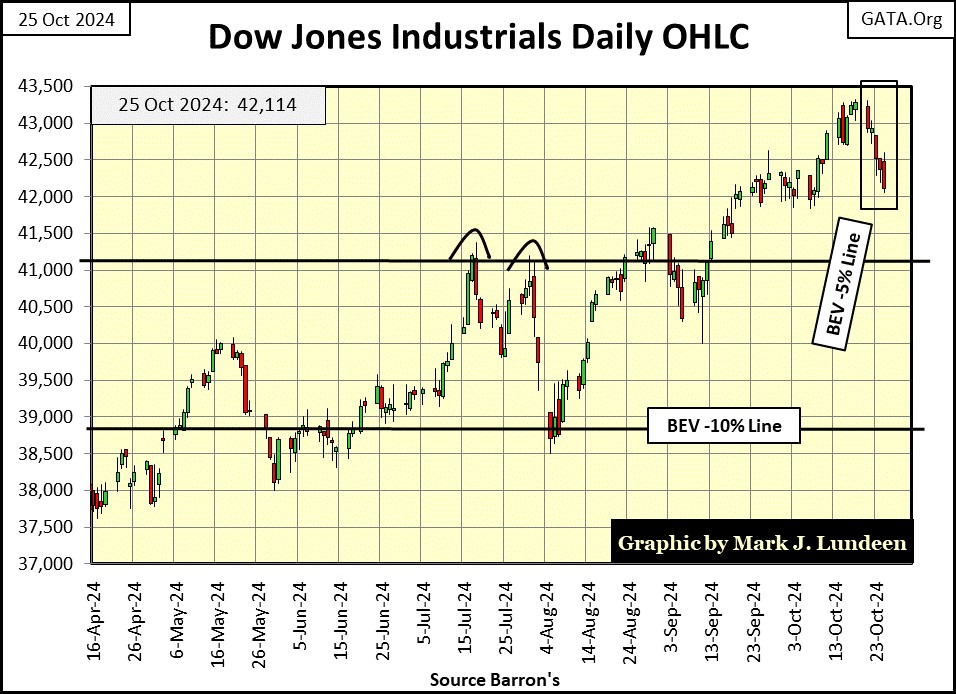
Of course, should selling pressure begin to increase as the Dow Jones closed below its BEV -5% line, sending the Dow Jones below its BEV -10% line, I’d soon stop being so optimistic on the stock market. And let’s face it, one of these days the Dow Jones will close below its BEV -10%, before it then closes below its BEV -20% line.
But it’s too soon to think of that now, not as long as the Dow Jones continues closing in scoring position; between its BEV 0% and BEV -5% Lines.
Looking at the Major Markets Indexes BEV values below, we saw only two new all-time highs this week, on Monday and Tuesday for the Russell Growth Index. But the week closed with fifteen of these indexes in scoring position, which leaves the market at the close of the week, with a bullish aura glowing around it.
Looking at the Average BEV in the table (#16), it was down almost a full percent from Monday to Friday’s close. That is a big move for this average, but something expected during a market correction, which is how I’m taking this week’s decline; a correction in a continuing bull market advance.
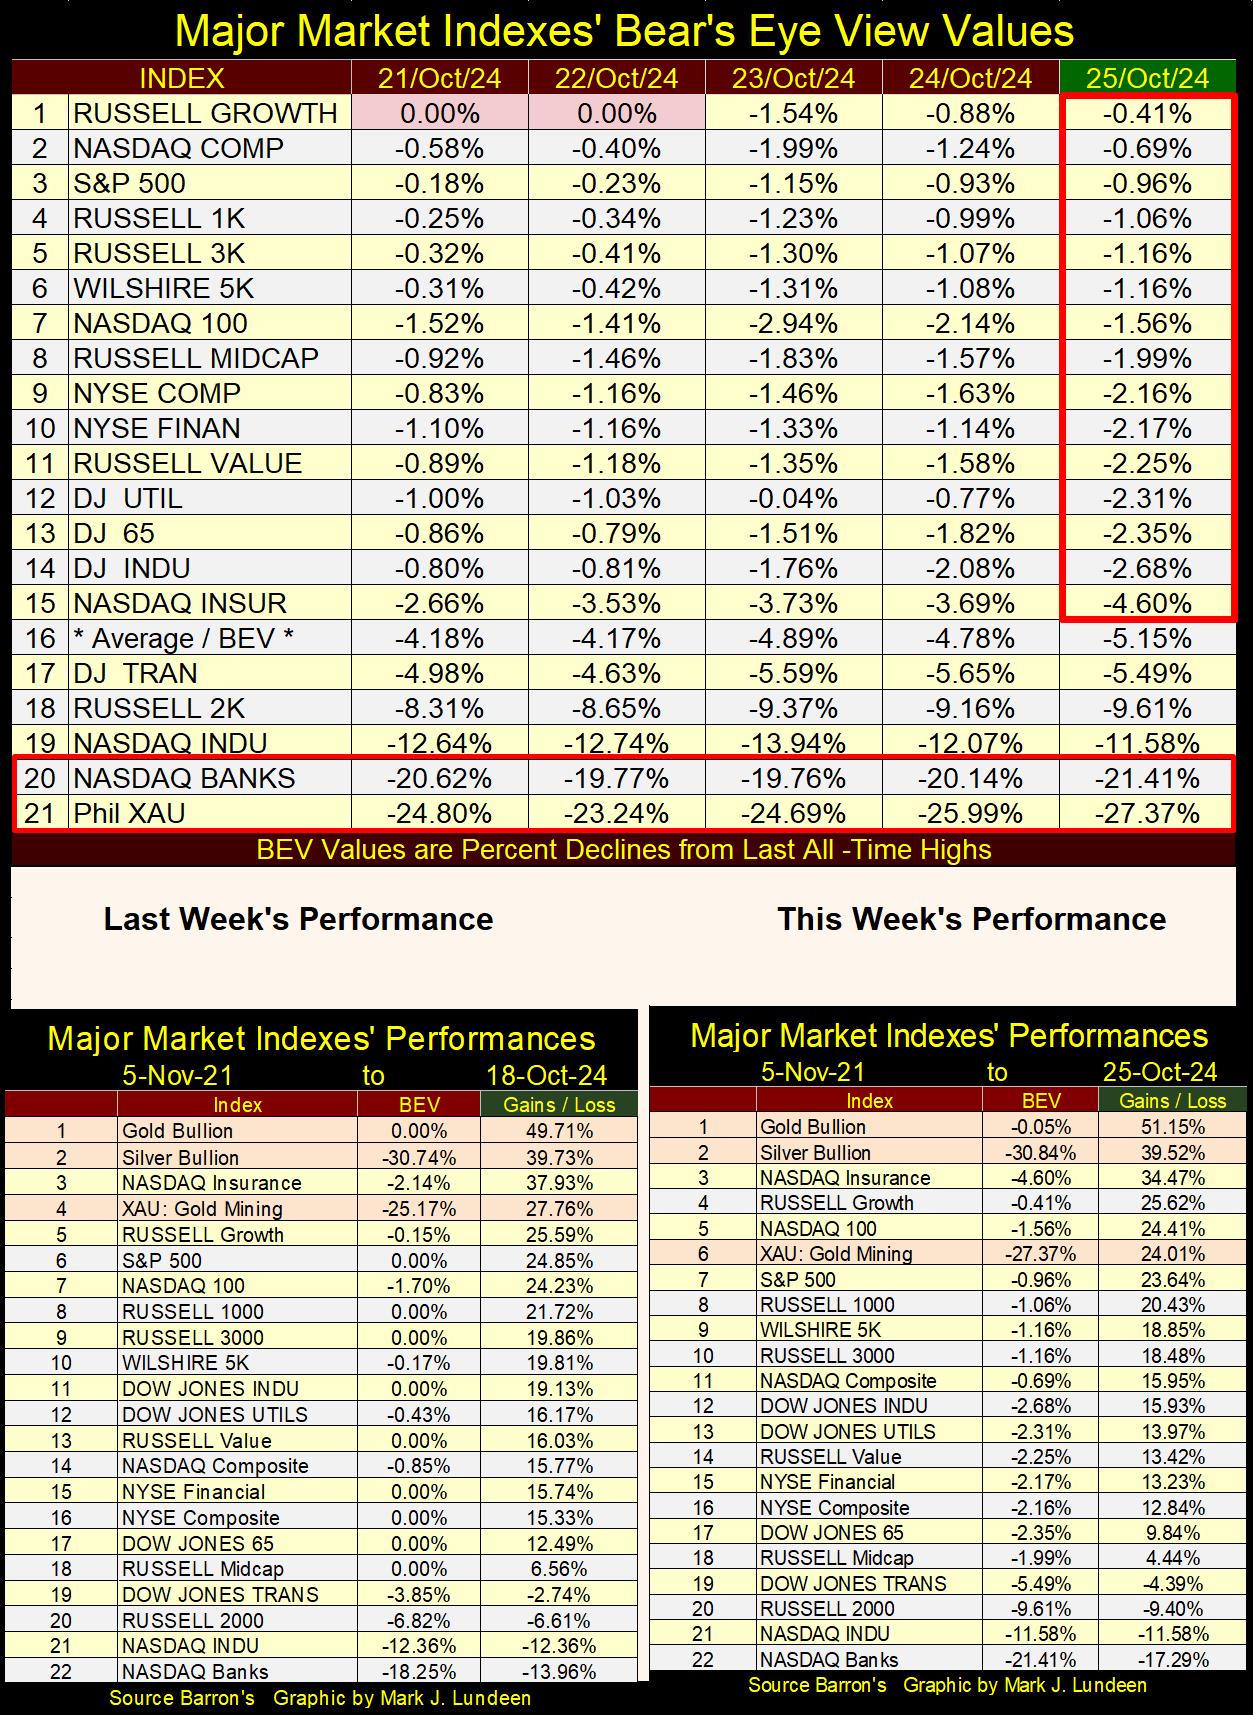
In the performance tables above, gold continues rising, while this week silver and the XAU were down slightly. The other indexes were down too, many by a full percent, or more from last week.
Bond yields (Red Plot below) are sneaking up once again. That isn’t good if you’re a bank holding T-bonds for reserves against deposits. In the chart below of a 30Yr T-bond issued in February 2020, bond yields bottomed in Barron’s 09 September 2024 issue. But seven weeks later, yields are now attempting to rise to their highs of 2024.
Rising bond yields are off the radar of most investors, but should bond yields continue to rise, the bull market on Wall Street has its days numbered.
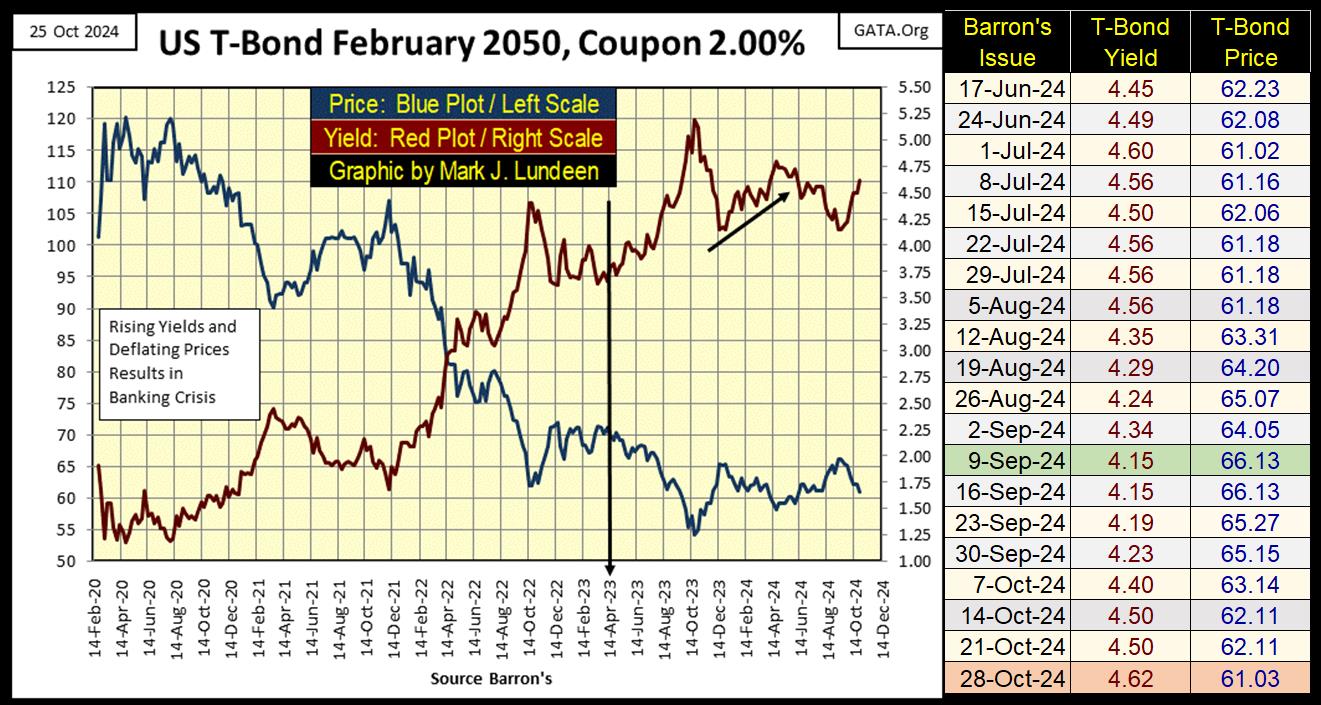
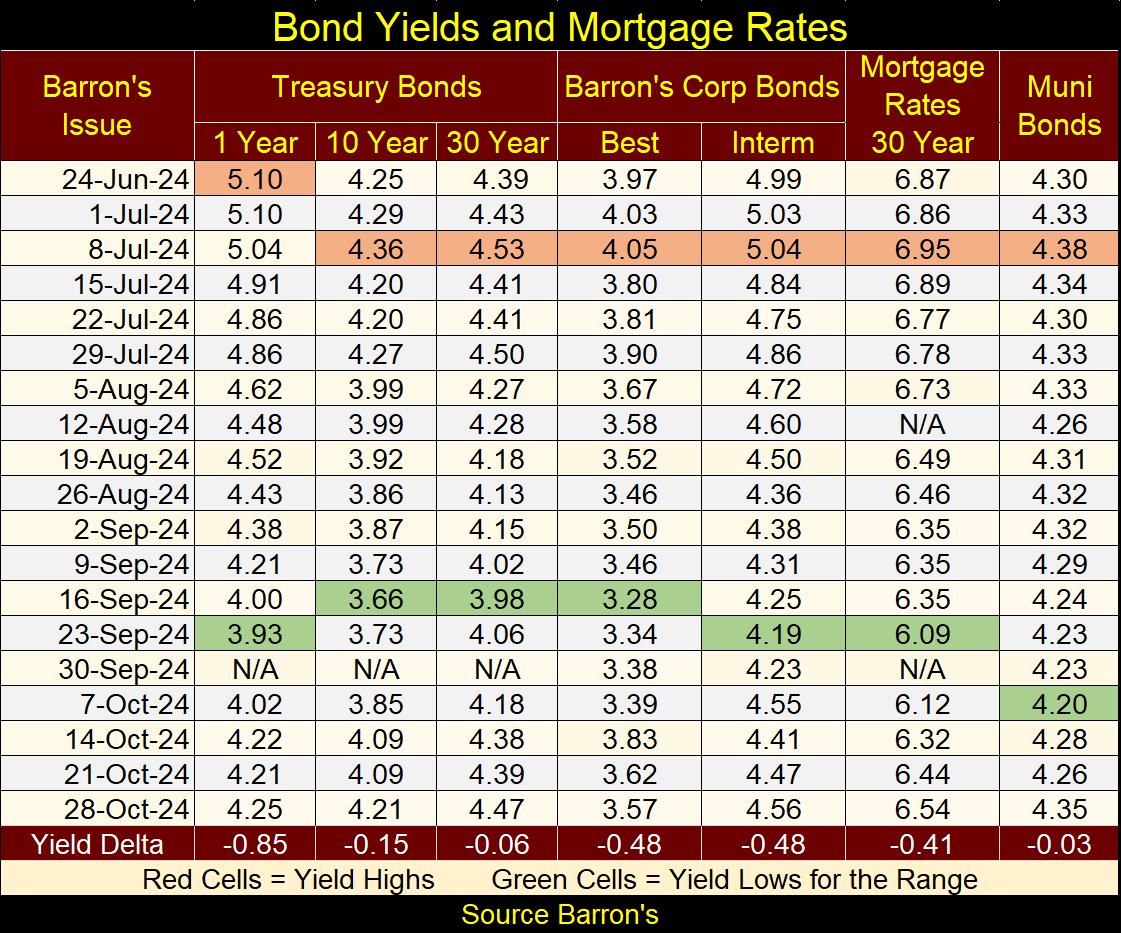
Rising yields isn’t just happening in the Treasury market, as seen in the table below. Since early September, corporate and muni-bonds are seeing their yields rise (valuations deflate), as are mortgage rates.
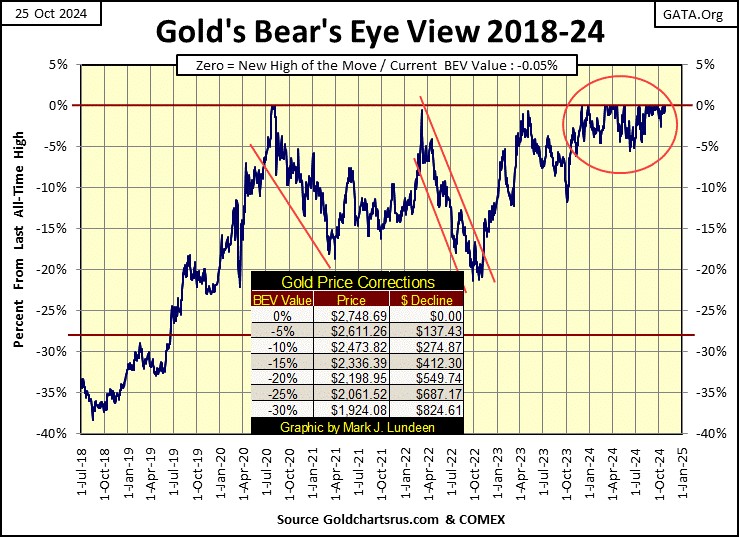
Let’s now look at gold’s BEV chart. Gold closed the week just a tad below its last all-time high. Or in other words; we can expect gold making additional new all-time highs in the weeks and months to come. I like that!
Gold’s daily volatility (Red Plot Below) seems low, for the move it has seen since entering scoring position last November. As seen in the chart below, daily volatility for gold and silver do change frequently. But where rising daily volatility for they Dow Jones is always bearish, its different for gold and silver.
Rising volatility for the old monetary metals means something is happening in their market place, something either bullish or bearish, something driving the flows of funds into, or out of the gold and silver market, results in daily volatility rising, as seen in the chart below.
One thing everyone should note in the chart below; gold and silver’s first bull market (1969 to January 1980) saw much greater daily volatility, than has our bull market, a bull market that began in February 2001.
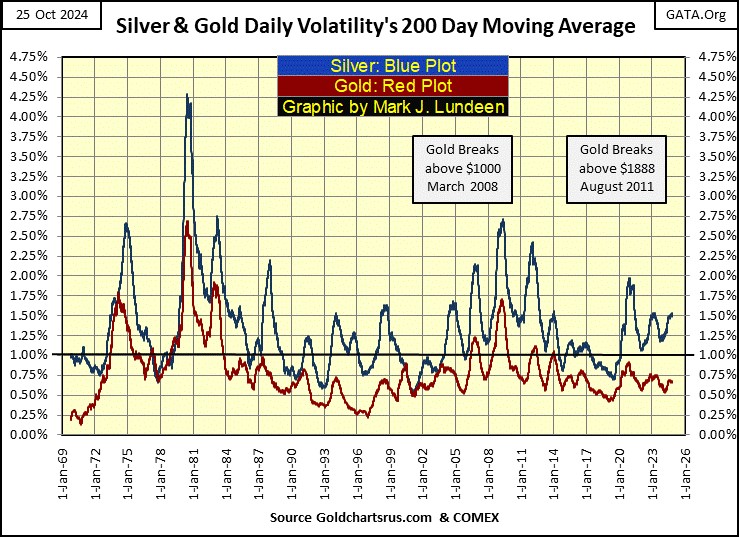
Why would that be? I’m convinced the difference in daily volatility from 1969 to 1980, and from 2001 to today, is the result of official sector (government) interference in the precious metals market.
Washington and Wall Street have no desire for people to sell their stocks and bonds, only to then buy gold and silver as a long-term hedge against economic disaster. So, they make the old monetary metals trade in a way, that discourages people from buying them. Killing any market excitement in gold and silver – rising daily volatility, is something they could do to make precious metals unattractive to new investors.
After seeing the Dow Jones advance from 800 in August 1982, to over 43,000 a few weeks ago, selling the stock market to buy some gold and silver seems to me a very logical thing to do. How much higher can this market advance take the bulls?
It’s not only the inflated valuations in the stock market that concerns me. Lots of things, both social and political, are becoming destabilized, and the stock market likes it when things are stable, predictable. In a world where chaos is increasingly becoming a major theme in the news, it will be gold and silver, not the Dow Jones that will benefit.
Considering the world, I see around me today, buying gold and silver at today’s low prices is a rational thing to do. But don’t expect to see my opinion on gold being validated by “market experts,” offered to the public by the main-stream financial media.
My next chart on gold’s daily volatility, plots every daily move in gold, up or down, in excess of +/-2.99%. Let’s call these days; gold’s 3% days, days where gold has seen a day of extreme volatility.
Since January 1969, gold has seen only 443, 3% days, as seen in the table at the bottom of the chart. But note; during its first bull market (1969 to 1980), gold saw greater daily volatility (bigger daily moves), and the frequence of its 3% days were greater than they have been since February 2001, when our current bull market in gold began. Just looking at this chart, one can see the differences between gold’s two bull markets of the past half century.
I’m just a market enthusiast, someone who can’t boast any unique-inside information on the gold and silver market. But I’ve been following these markets since the early 1970s, and seeing what I see below makes me angry, at how gold and silver bulls, such as myself have been abused by the same institutions, that took the US dollar off its Bretton Woods’ $35 gold peg in 1971.
There was only one reason for them to break the dollar’s last link to the old gold standard; they intended to inflate the supply of dollars, for whatever their reason, none of them good. Allowing the dollar to float, independent of gold or silver was an act of destruction on the economy that depended on the dollar, as anyone familiar with the history of paper money would know. For instance; Lenin.

I like the quote below. It has nothing to do with money or precious metals, but it does shine a light on the darker side of humanity, that unfortunately is always there, just waiting for an opportunity to break out.

Back to volatility in the gold market; as I read this chart, the reduction in daily volatility seen post 2001, as gold increased from $253 to $2,748.69 is very odd.
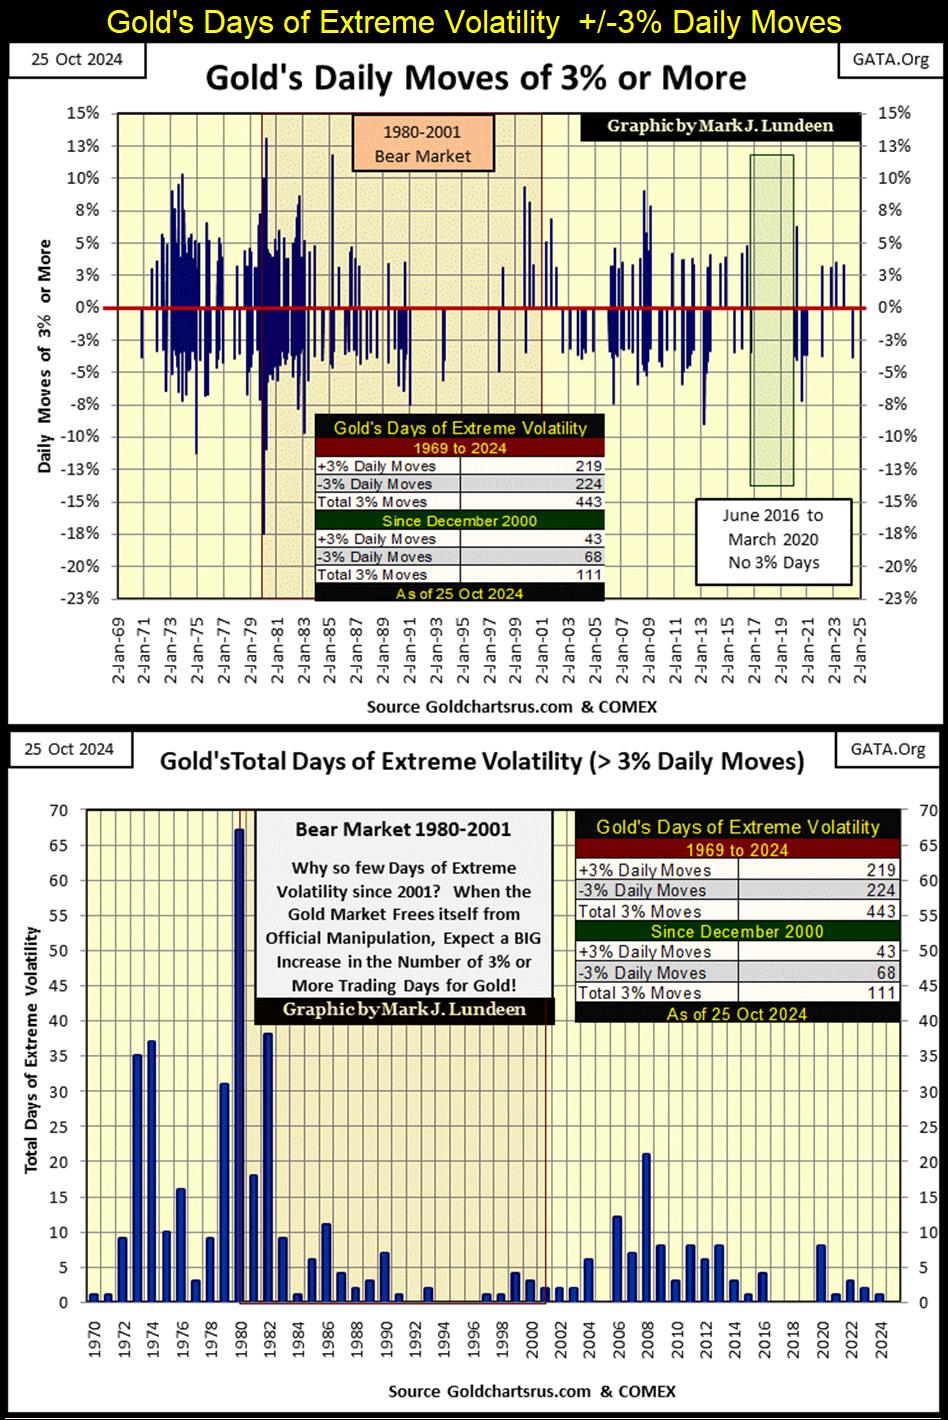
A better view of our low-volatility bull market in gold is seen above. The bottom chart is from the same data seen in the top chart, just the totals of gold’s 3% days by year.
It’s remarkable how gold increased from $253 in February 2001, to $2748 just last week, with so few days of extreme volatility (+/-3% days) in the past twenty-three years. This begs the question; why was the bull market of 1969 to 1980 so volatile, while our bull market in gold has been so docile? Again, I suspect the difference seen above is the result of government regulation of the gold market.
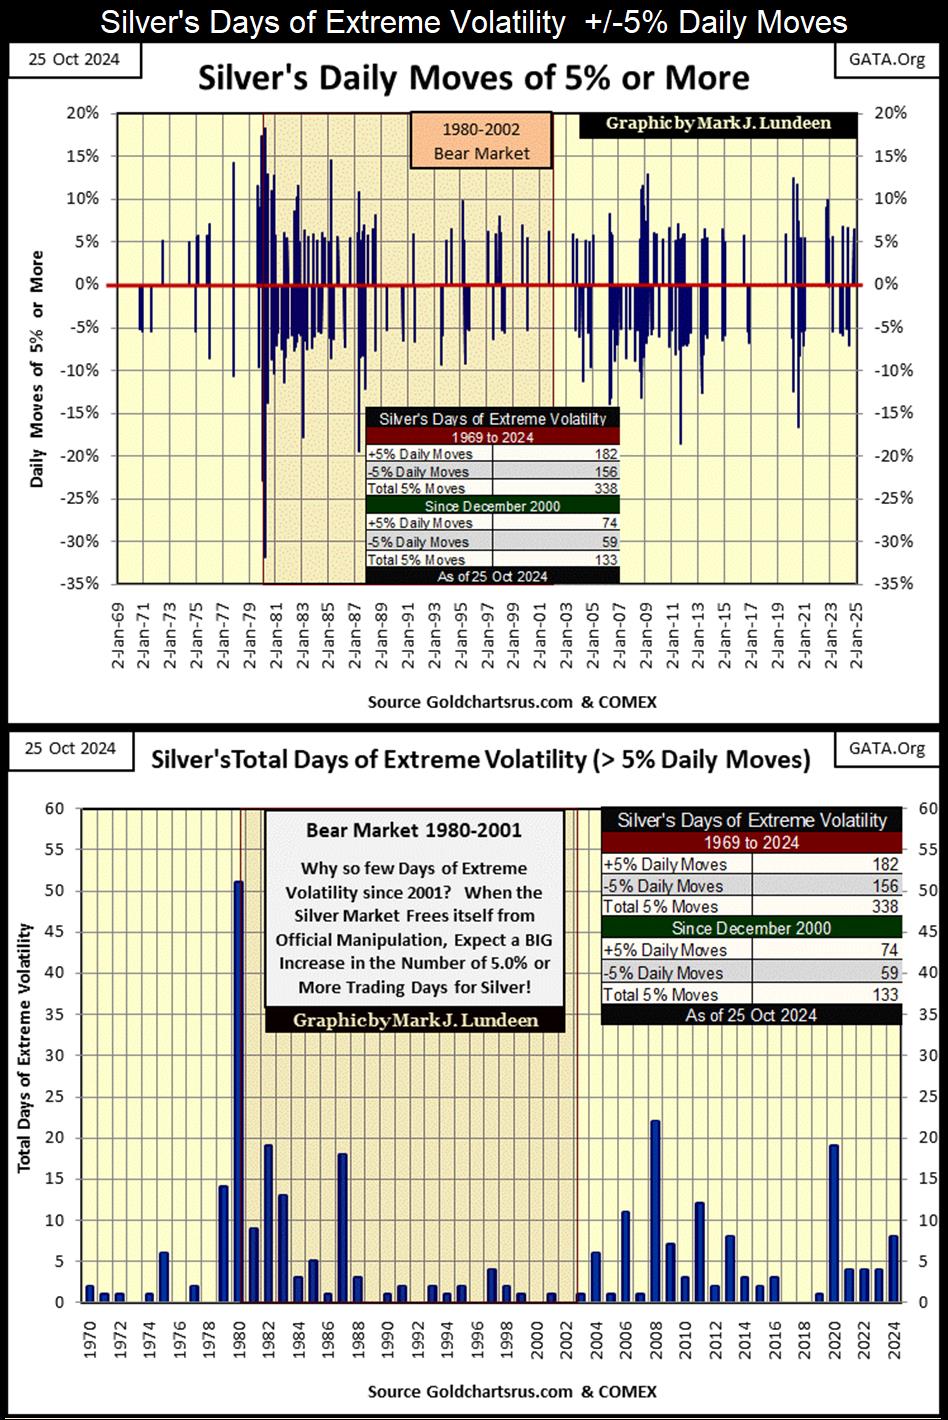
Below I’ve created the same charts seen above, but for silver, which I’m posting with no comment. Well, one comment I should make is silver’s last all-time high is still from January 1980, forty-five years ago. At this week’s close, silver was trading for 31% less than its last all-time high.
Other than silver, what else is selling for 31% less than it was selling for in 1980? Absolutely nothing that I can recall. One of these days, silver is going to be the hottest investment of a life’s time. Get some now, when it is still selling for cheap.
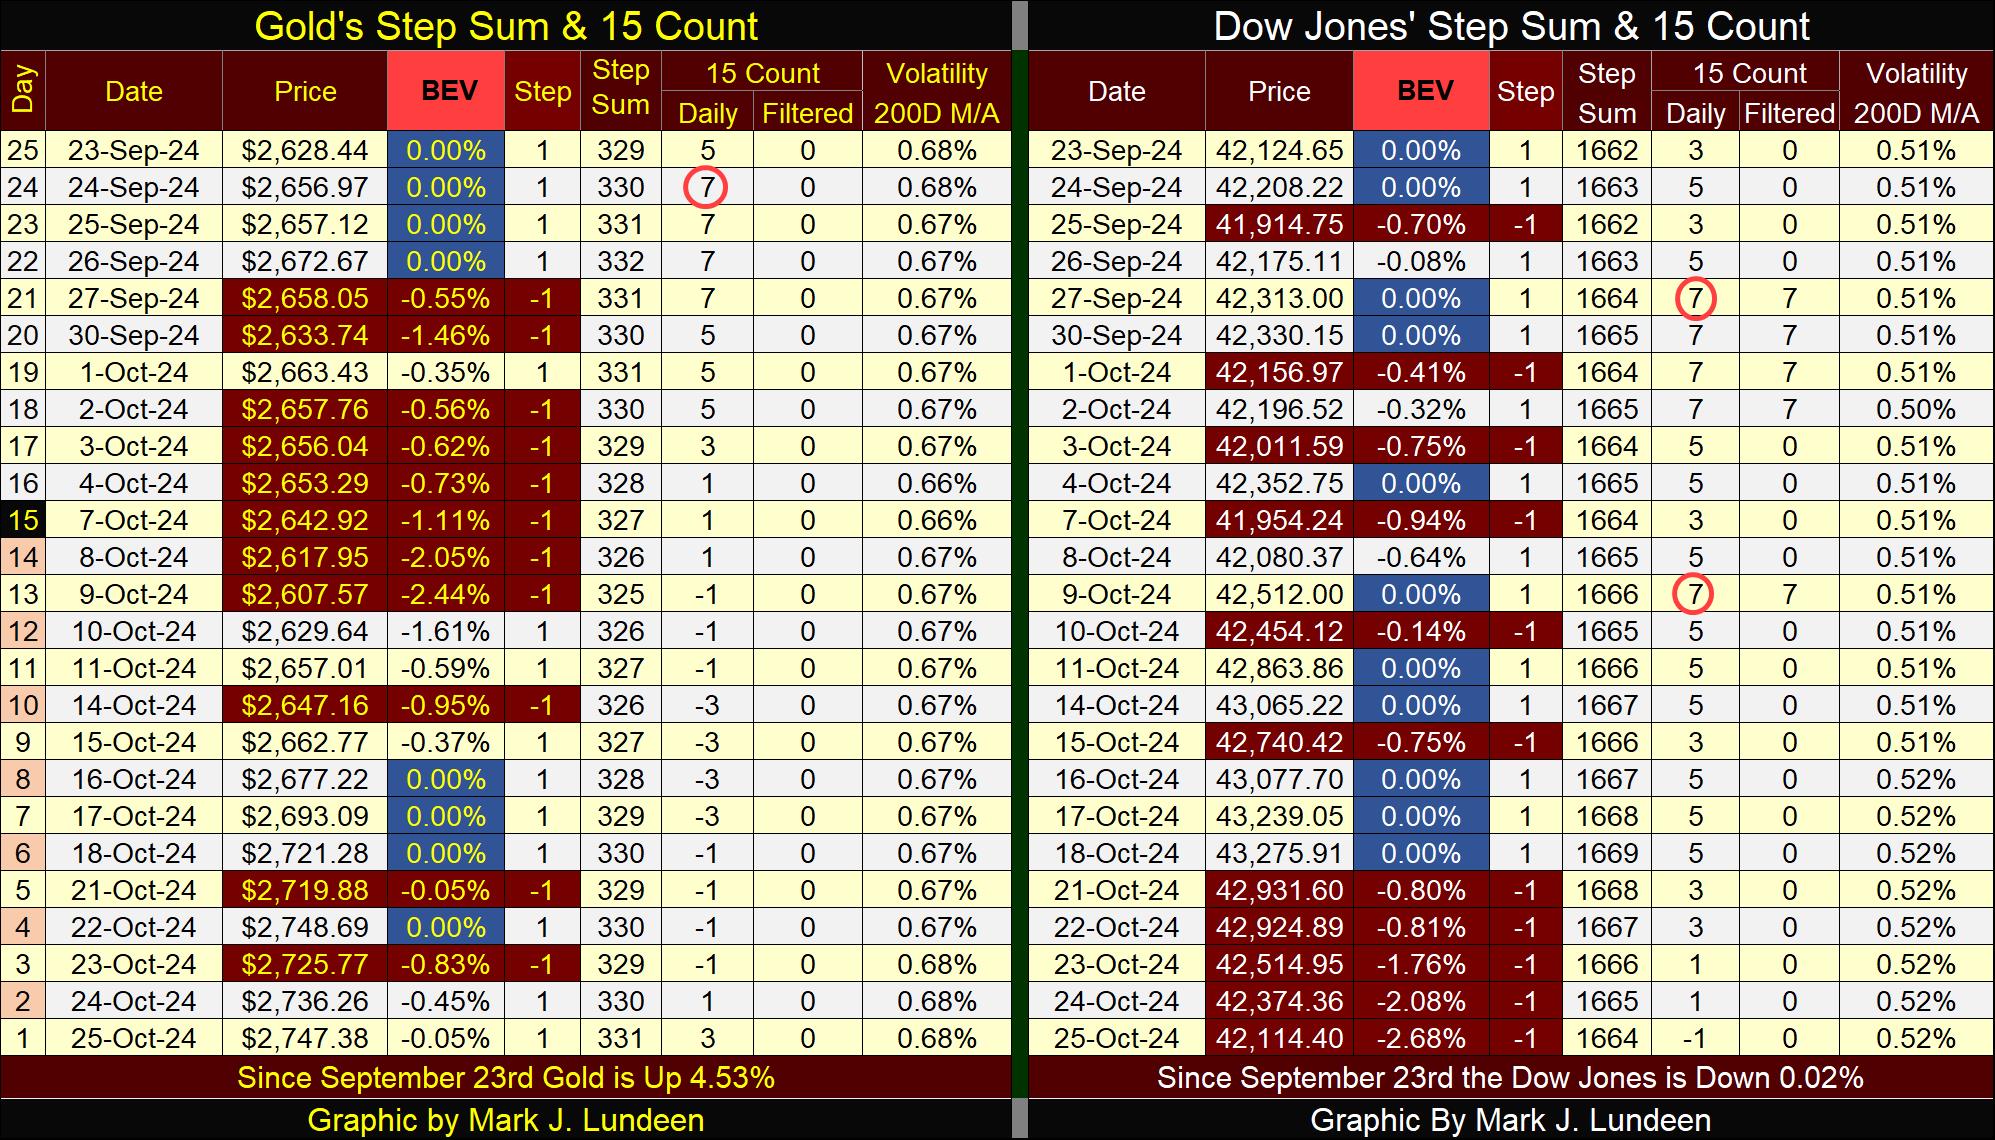
On gold’s side of the step sum table, we see how gold saw some selling pressure in early October, then on October 10th, advancing days once again began to dominate down days, and gold once again began making new all-time highs.
I’m thinking this is what the Dow Jones will do on the right side of this table, when once again it too sees advancing days outnumbering down days; a resumption in the bull market advance.
Well Mark, you’re darned bullish on the Dow Jones / stock market if you believe more new all-time highs are still coming our way.
Well, I guess I am. But, and it’s a BIG BUT, I also see cracks beginning to form on the foundations supporting the market advance in the stock market.
Many times, I’ve pointed out the problem of debt financing for consumption. Whether consumptive debt is used to fund corporations’ share buyback and dividend programs, or wage earners using credit card debt to buy most of what they own, or the US Federal Government using debt to fund multi-trillion-dollar wars to bring democracy to central Asia. At some point, the money is gone, and all that is left is the debt that must be serviced.
“Consumers Running Out of Money?” Good Grief! Most consumers have been broke for decades. The real problem with consumers today is; the banking system is afraid of extending any additional credit to generations of consumers, who are having difficulty servicing the debt they took on for last year’s Christmas.
Back when the dollar was pegged to gold, when politicians and bankers couldn’t print up as many paper dollars as they wanted, consumers paid cash for all they purchased. They, and the economy were better off for them doing so.
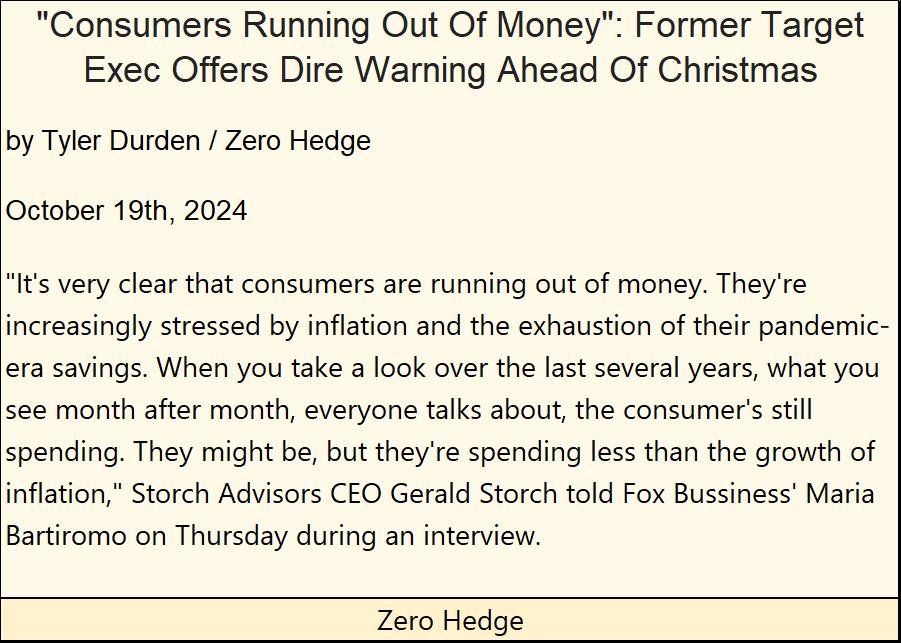
A better way of understanding the above article, would be to swap “consumers” with addicts, and “money” with crack cocaine. In the past century, central bankers have addicted the world to easy credit, at attractive rates. This won’t end well.
Mark J. Lundeen
********


