Gold’s Price Spike; Fed’s Next Hike


“This is where it starts to get fun.”
If said phrase ran across your mind during this past week, worry not: for it, too, ran through our mind. And thus it having run through both your mind and our mind, then it also ran through the many minds of those financially math-inclined. For there was more meat in this past week than one might have expected to digest (barring having imbibed in a settling digestive).
First, per our title, let’s assess “Gold’s Price Spike”. For en route to (barely) completing a seventh consecutive up week, Gold on Tuesday made a “Trump Tariffs!” spike up to as high as 2968, a mere 32 points from achieving the Golden Goal Two of “milestone” 3000. For whilst much of the western world slept, Gold took off like a jet from Tuesday’s open at 2937 to 2968, a +31-point spike in just three hours. ‘Course it being a price spike, ’twas swiftly short-lived and then some within the 30 minutes that followed.
Further, given fears of renewed inflation made manifest come Wednesday’s StateSide Consumer Price Index, Gold gave up the entirety of the week’s gain to that point on the metric’s staggering shock. But, another “Global Trade War!” buying binge nonetheless ensued, only to be purged anew, Gold then settling yesterday (Friday) at 2894 for a bare gain of just +8 points for the week. Here are those five days (10-14 February) by the hour:
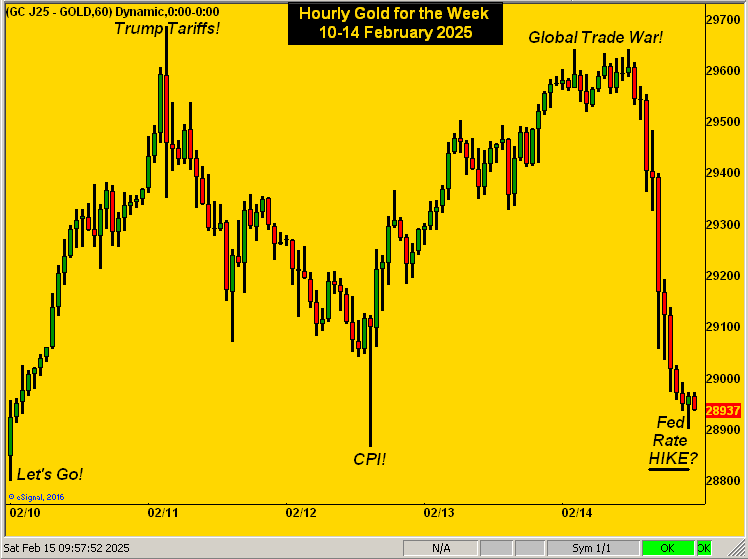
And no, thy eyes do not thee deceive, for on the graphic ’tis queried “Fed Rate HIKE?” Indeed, with respect to the balance of this week’s title, recall these statements from the past two editions of The Gold Update:
1) 01 February: “…an inflation scare followed by a Federal Reserve rate hike, should they dare, something for which the financial world at large seems unaware…”
2) 08 February: “…an inflationary scare could cause a Fed flare (again, should they dare), in turn substantiating a Gold price pare…“
Indeed a scare: January’s headline CPI pace of +0.5% was well beyond experts’ consensus of +0.3%, as too was the core of +0.4%.
But wait there’s more: The Producer Price Index then arrived Thursday — also above consensus — with headline and core respectively +0.4% and +0.3% … but did you see the revisions to December’s paces? Headline PPI was recalculated from +0.2% to +0.5% and core from a flat 0.0% to +0.4% –> Across the 27 years of maintaining the Economic Barometer, ’tis but the third time headline PPI has been revised by +0.3% (and never greater) and the very first time core has been revised by as much as +0.4%. Is this a result of too much holiday consumption of “egg nog” over there at the Bureau of Labor Statistics? Such are the optics… Again per our opening statement “This is where it starts to get fun.”
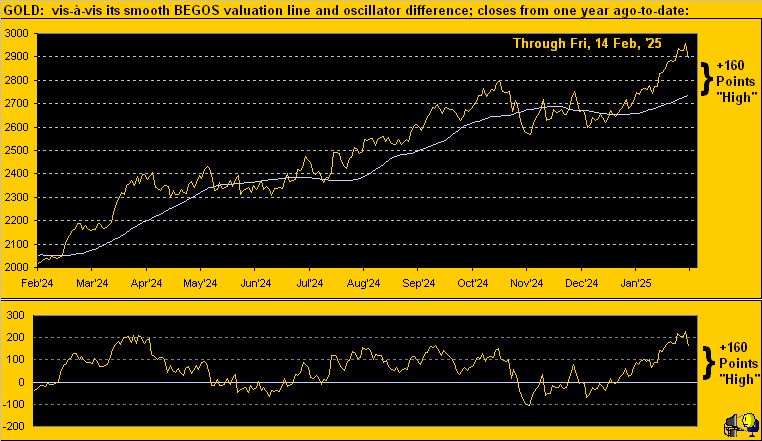
As to Gold’s rightmost price spike — indeed to another All-Time High of 2968 — here ’tis graphically portrayed by the weekly bars from one year ago-to-date, the blue-dotted parabolic Long trend now four weeks in duration:

Certainly still in play is our Golden Goal Two “milestone” level of 3000. And yes, ’tis still quite reachable during the course of this current Long trend. Yet that said, we see (at least one) down week ahead. To be sure, Gold today at 2894 fundamentally remains -25% undervalued vis-à-vis the opening Gold Scoreboard’s Dollar debasement value of 3837. But near-term Gold is technically overvalued as we again bring up our BEGOS Markets’ (Bond / Euro / Gold / Oil / S&P 500) metric for pricing Gold per its movement relative to those of the other four components. And by the lower panel oscillator of price less value, Gold now reads as +160 points “high” above its smooth valuation line:
Moreover by standardized technical measures (our cocktail of Bollinger Bands, Relative Strength and Stochastics), we’ve Gold now “textbook overbought” through 25 consecutive trading sessions dating back to 10 January … just in case you’re scoring at home. So whilst Goal Two for “milestone” 3000 remains well in the cards, (not to mention Goal Three of 3262 for this year’s forecast high), uni-directionality applies neither to Gold nor any major market, which for you WestPalmBeachers down there means Gold shan’t go straight up.
Still, making a bit of a turn up of late is the aforementioned Econ Baro. As you long-time readers know, inflation — which just “suddenly” leapt back onto center stage — when rising is a Baro positive as nominal levels of various metrics increase in kind. ‘Course as we’ve herein mentioned, ’tis stagflation that’s the worry. Recall this from two missives ago with respect to the first peek at Q4’s Gross Domestic Product: “…per the ‘Chain Deflator’, whereas inflation contributed to 38% of nominal Q3 GDP growth, for Q4 the inflation component increased to 49%. Thus … slowing growth + increasing inflation = stagflation…“ And did you note the downswing in January’s Retail Sales by -0.9% versus +0.7% for December?
“But mmb, that’s just seasonal after holiday spending…”
Au contraire, mon Squire cher. Through the past 27 years, only 12 (44%) of such December-January seasonal shifts have been negative. A bit too much information perhaps, but conventional wisdom is oft oxymoronic. Here’s the Baro:
Meanwhile, the stock market as measured by the S&P 500 (6115) is but a wee -0.2% below its intrad-day all-time high (6128 this past 24 January). In turn, our honestly-calculated “live” price/earnings ratio is now 47.7x. (Yes, we comprehensively understand that earnings have become completely irrelevant to pricing shares; otherwise, the S&P today would be just either side of 3000).
So instead, ’tis “Nuthin’ but Fed!” And therein lies the confusion. The StateSide President is insistent that the Fed further cut rates. FedChair Powell sees the economy as too robust to warrant rate cuts. And we see inflation as reasonably rampant to warrant rate hikes. For not only has inflation not calmed down to the Fed’s preferred +2.0% annualized target, ’tis instead now moving further up and away from it. Still, the “Fed favoured” inflation gauge (Personal Consumption Expenditures) for January doesn’t arrive for another two weeks (28 February). If that too has popped, words such as “hike” and “raise” shall start to be FinMedia propped.
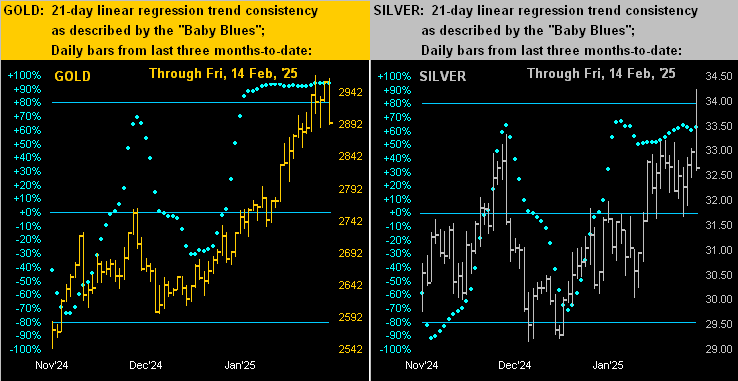
Left without a prop on Friday were both Gold and Silver: the yellow metal’s intra-day drop of -2.5% was the worst since 18 December, whilst that for Silver of a whopping -5.5% was its worst since 12 December. Both cases are below shown by their rightmost bars for Gold on the left with Silver on the right. ‘Tis been a fine move — especially for Gold — across the past three months-to-date, albeit Friday might be referred to as a “technical failure” rather than an imminent trip toward Goal Two (“milestone” 3000). That stated, as technically overbought is our Gold, ’tis primarily at present being fundamentally driven from one headline to the next, (per our hourly chart earlier displayed). And as ever, mind those “Baby Blues” of trend consistency(!):
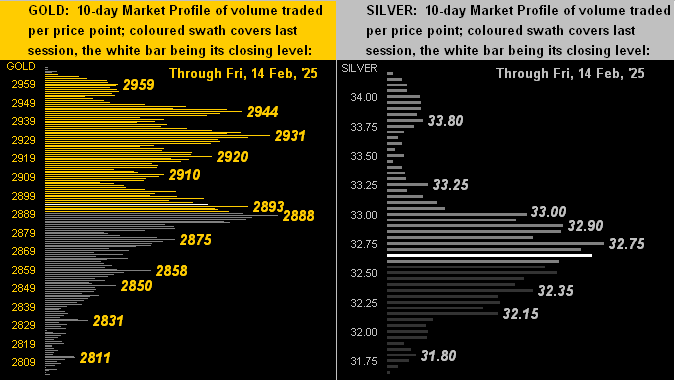
Too for the precious metals we’ve next their 10-day Market Profiles for Gold (below left) and for Silver (below right). The yellow metal (currently 2894) may turn dicey sub-2888, whilst the white metal (currently 32.66) has just slipped under her 32.75 dominant volume support price:
So if you are thinking that we are thinking “down” is Gold’s watchword for this ensuing week, yes we agree, albeit as aforementioned, price of late is being headline-driven. Still as we turn to the stack, Gold year-to-date is well in the black:
The Gold Stack
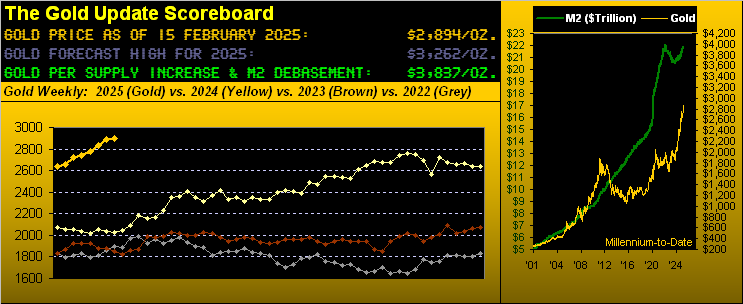
Gold’s Value per Dollar Debasement, (from our opening “Scoreboard”): 3837
Gold’s All-Time Intra-Day High: 2968 (11 February 2025)
2025’s High: 2968 (11 February)
10-Session directional range: up to 2968 (from 2802) = +166 points or +5.9%
Gold’s All-Time Closing High: 2957 (13 February 2025)
Trading Resistance: notable overhead Profile nodes 2931 and 2944
10-Session “volume-weighted” average price magnet: 2903
Gold Currently: 2894, (expected daily trading range [“EDTR”]: 34 points)
Trading Support: most notably 2888, then 2875
2025’s Low: 2625 (06 January)
The Weekly Parabolic Price to flip Short: 2607
The 300-Day Moving Average: 2424 and rising
The 2000’s Triple-Top: 2089 (07 Aug ’20); 2079 (08 Mar’22); 2085 (04 May ’23)
The Gateway to 2000: 1900+
The Final Frontier: 1800-1900
The Northern Front: 1800-1750
On Maneuvers: 1750-1579
The Floor: 1579-1466
Le Sous-sol: Sub-1466
The Support Shelf: 1454-1434
Base Camp: 1377
The 1360s Double-Top: 1369 in Apr ’18 preceded by 1362 in Sep ’17
Neverland: The Whiny 1290s
The Box: 1280-1240
Next week brings just a moderate dose of data for the Econ Baro, notable of which come Thursday (20 February) is the Conference Board’s Leading Indicators for January. Again for regular readers, you know our penchant for referring to such metric as “lagging” given the Baro has already told the tale. Thus the consensus for a flat January — or maybe +0.1% at best — makes sense.
Just ensure your Gold and Silver portfolio shares are many percent!
Cheers!
…m…
www.TheGoldUpdate.com
www.deMeadville.com
and now on “X”: @deMeadvillePro
********

Mark Mead Baillie has had an extensive business career beginning in banking and financial services for two years with Banque Nationale de Paris to corporate research for three years at Barclays Bank and then for six years as an analyst and corporate lender with Société Générale.
For the last 22 years he has expanded his financial expertise by creating his own financial services company, de Meadville International, which comprehensively follows his BEGOS complex of markets (Bond/Euro/Gold/Oil/S&P) and the trading of the futures therein. He is recognized within the financial community of demonstrating creative technical skills that surpass industry standards toward making highly informed market assessments and his work is featured in Merrill Lynch Wealth Management client presentations. He has adapted such skills into becoming the popular author each week of the prolific “The Gold Update” and is known in the financial website community as “mmb” and “deMeadville”.
Mr. Baillie holds a BS in Business from the University of Southern California and an MBA in Finance from Golden Gate University.


