Gold at The Crossroads - Analysis With Reference To Dollar and Cot...
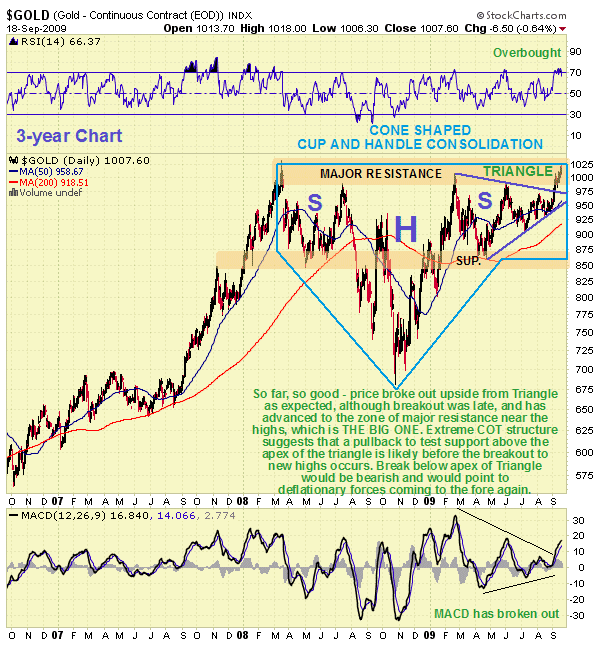
In this article we are going to review in a dispassionate manner what gold has and hasn’t achieved in recent weeks and make deductions about the outlook. September is by far the strongest month for gold on a seasonal basis and this year has been no exception. Early in the month it broke out of the large Symmetrical Triangle that had been forming for most of this year, an event which naturally led to wild enthusiasm amongst goldbugs and most of their cheerleaders and expectations by most of follow through to the $1300 area as a minimum objective. While it has since advanced to challenge its highs, and has succeeded in making a new closing high, it has not - yet - made a new all-time high by closing above its intraday highs of last year. Thus it has not yet overcome the resistance near its highs.

There were 2 factors giving rise to concern following the breakout, and which are increasing the risks of a reversal or at least a test of the breakout level. One is the fact that breakout from the Triangle did not occur until the price had got very close to its apex, which makes the breakout less reliable. The second factor giving grounds for caution is the extreme COT readings - Commercial short and Large Spec long positions have “flown off the scale” indicating speculative froth that might need to be cleansed before we see a big move up to the $1300 area. The point to grasp here is that while gold did stage a breakout from the triangular pattern that formed during most of the year, it could have been a false move, and it HAS NOT yet broken out above the strong resistance near its highs and right now it is overbought on short - term oscillators and showing COT readings that we would normally expect to lead to a possibly prolonged reaction.

Another point to consider is that the giant consolidation pattern or top that has formed in gold over the past 18 months has gone on for so long that we really have to factor in the dollar’s net change during this period. As we can see below the chart for the gold price divided by the dollar index reveals that it is actually quite some way from breaking out to a new high in constant dollar terms. What this implies it that any marginal break out to new highs in the near future could be a phony - a trap, especially if the COT structure gets any more extreme.

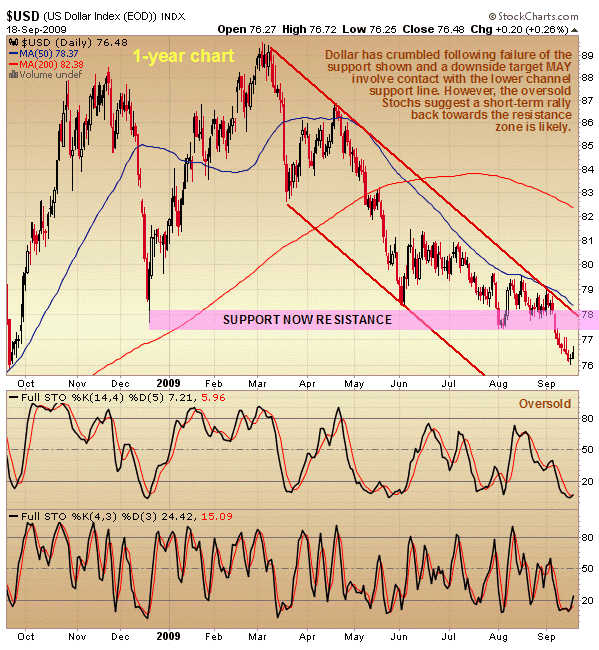
What about the dollar? Although the longer-term outlook for the dollar remains grim, the charts reveal that it could be on the verge of a countertrend rally, as it is now oversold after a steep drop this month that has taken stochastics to their normal oversold limit. It is very hard to find a dollar bull now and this fact and the technicals mean that it is as good a time as any for the dollar to rally - which would very likely take the wind out of gold’s sails. So all in all, it looks like a good time for gold to react back here. While there is nothing to say that despite these factors the dollar won’t simply continue to drop and gold power ahead towards $1300 with nary a pause, what seems to be the higher probability now, and healthier in terms of sustaining a solid uptrend in gold would be if it now reacts back in sympathy with a dollar rally to test the breakout point above the nose or apex of the Triangle before turning higher again and making a decisive breakout above the highs. Such a scenario would unwind the current short-term overbought condition, ease the current COT extremes, shake out weak hands and provide an excellent late buying opportunity. Such a reaction appears to be almost a necessity with silver which much more overbought than gold right now and nursing an even more extreme COT structure.

A break below the crucial support at the nose or apex of the Triangle would be interpreted as very bearish as it would open up the prospect of an “end run” collapse, revealing the entire pattern from March last year to have been a giant top area. This would of course have profound implications as it would mean that the global debt and credit fuelled “recovery” is aborting as the powerful undercurrent of deflationary forces overcomes the reckless global ramping of the money supply and credit. This could be brought about by a funding emergency in the US if it is unable to maintain capital inflows due to a crisis of confidence that drives up interest rates. It is considered unlikely however as they can be expected to monetize debt to whatever extent is necessary to “keep the show on the road” regardless of inflationary consequences, which is why hyperinflation is actually the greater risk. However, investors and traders should remain aware of this risk and place stops beneath the apex of the gold Triangle - you always have the option to get back in if such a breakdown occurs and proves to be a false move.
Clive Maund, Diploma Technical Analysis
[email protected]
www.clivemaund.com
Copiapo, Chile, 19 September 2009


