Gold Forecast: Gold Cycle Update


 From my prior articles, Gold is back in mid-term topping range, and with that is at risk to a larger-degree decline phase in the coming months. Having said that, this decline has yet to be confirmed in force, though we are keeping a close watch on the current price action for signals of a key peak having formed.
Gold's 72-Day Cycle
The 72-day cycle is the most dominant cycle in the Gold market, and is shown again on the chart below:
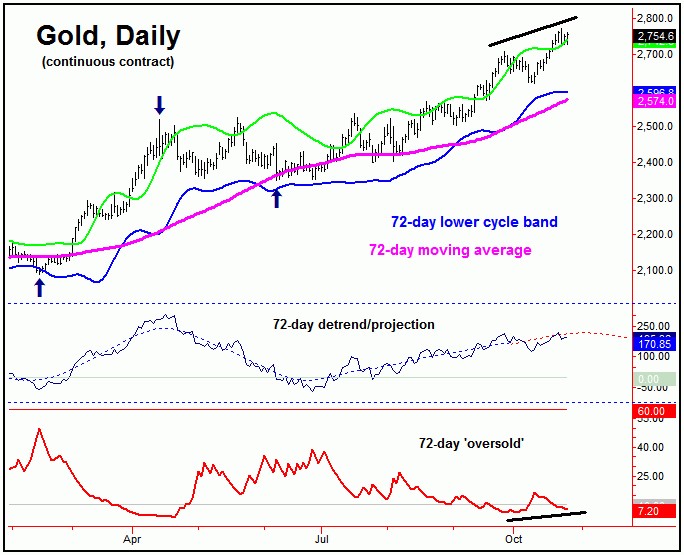
The next larger swing top has been expected to come from this 72-day cycle - which is well into extended range for its peak to form. Once this wave does top, then the downside 'risk' - and ideal price magnet - will be back to the 72-day moving average for Gold. However, based upon the position of our 310-day wave, the probabilities are good that the next peak for the 72-day wave will also top the larger cycle.
As originally mentioned in our Gold Wave Trader report back in June, it was the reversal above the 2408.10 figure which confirmed the current upward phase of this 72-day cycle to be in force, which has seen a gain of more than 350 points through that figure.
With the above, traders are always best to wait for the upside/downside reversal points to be taken out, before flipping their market direction. The reversal figures work particularly well with the 72 and 310-day cycles, due to their high-percentage rally and decline phases - normally some 14-25% for the Gold market.
The 310-Day Cycle
Above the 72-day wave for Gold, there is the larger 310-day cycle, which last bottomed back in October of last year - and is shown on the chart below:
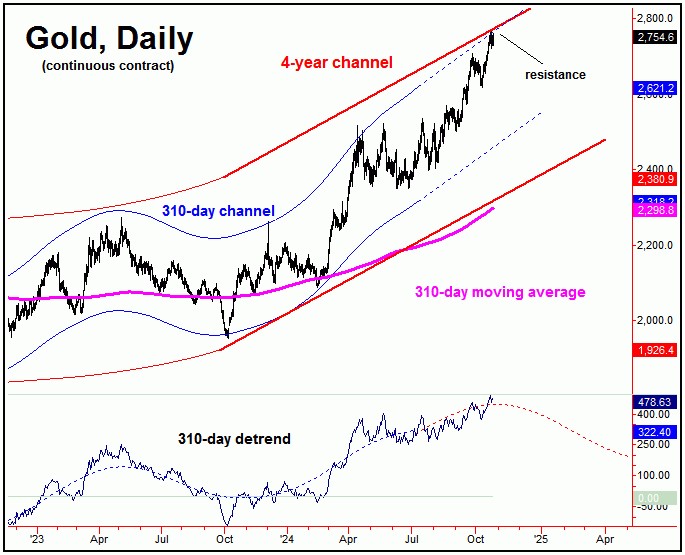
For the bigger picture, this larger 310-day cycle is currently going over a very wide peak. In terms of price, key resistance is near the intersection of the upper 310-day and four-year cycle channels, which we are currently testing - though this level is rising daily, as the channels are also rising.
Once this 310-day wave does top, the probabilities will favor a sharp correction playing out into what looks to be the first few months of next year. In terms of price, the 310-day moving average would be an ideal magnet to the next downward phase of this cycle, with that moving average at or near the lower four-year cycle channel.
Going further, that lower four-year channel would be key long-term support for the Gold market, and would be favored to hold the coming correction phase of our 310-day cycle - if the larger uptrend is to remain intact with a bigger four-year wave, which is the current assumption.
The 4-Year Cycle
Above the 72-day and 310-day cycles, there is the larger four-year wave in Gold, which is shown on the chart below:
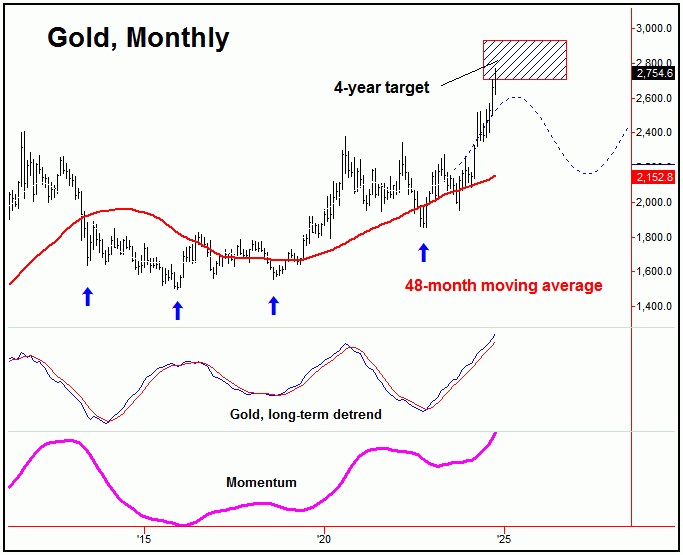
In terms of price, many months back we confirmed an upside target with our four- year cycle to the 2706-2935 region for Gold. With that, the most recent high has met the lower-end of this target range.
Having said that, with more time left on the current upward phase of this four-year cycle, the overall assumption is that a try at the upper-end of this range is going to be seen, though with an in-between (and countertrend) correction with our 310-day wave playing out into early next year.
With the above said and noted, a correction with our 310-day wave should find support near the aforementioned lower four-year cycle channel. If correct, what follows should be another rally of some 20-25% or more, playing out into later next year - then to be on the lookout for the next four-year top in Gold. That peak should eventually give way to a correction back to the 48-month moving average on is next downward phase.
In terms of price, we are watching our key downside 'reversal points' for each of the 72 and 310-day time cycles in Gold. When taken out to the downside, these will confirm the next correction phase of these waves to be back in force, with exact details of these reversal figures always posted in our thrice-weekly Gold Wave Trader report.
Jim Curry
The Gold Wave Trader
Market Turns Advisory
http://goldwavetrader.com/
http://cyclewave.homestead.com/
********
More from Gold-Eagle


