Gold Forecast: Gold Cycles Forming Mid-Term Top


 From my prior articles, the last key low for Gold came with the bottoming of our 72-day cycle - made back in early-June. From there, the analysis called for strength into the late-July timeframe or beyond, before looking for indications of the next mid-term peak forming - one which is due to materialize at anytime.
Gold's 72-Day Cycle
The aforementioned 72-day cycle is the most dominant cycle in the Gold market, and is shown again on the chart below:
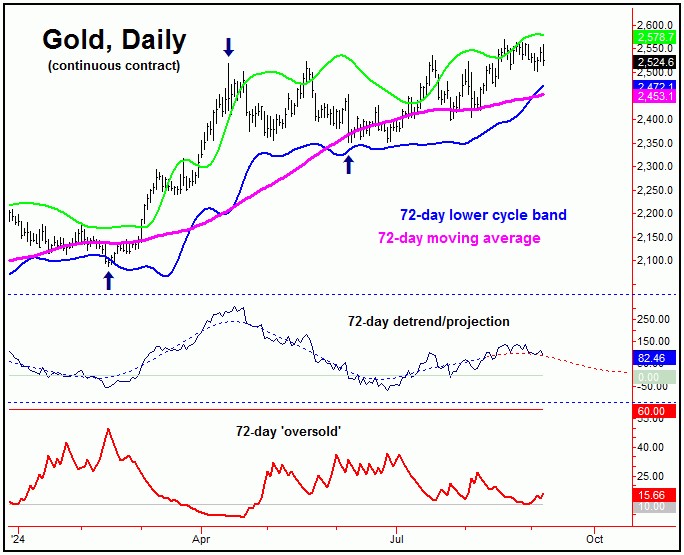
So far, the highest high made for the most recent upward phase of this 72-day cycle was the 2570.40 swing top, made on 8/20/24. With that, there is at least some potential for this number to have topped this cycle, though this has yet to be confirmed.
In terms of price, any reversal back below the 2500.70 figure (December, 2024 contract) - if seen at any point going forward - would best confirm this 72-day wave to have topped. Going further, that action would put the 72-day moving average as the expected magnet in the days/weeks to follow.
With the above said and noted, as long as Gold is able to remain above the 2500.70 figure in the coming days, then it can actually spike back to make higher highs (above 2570.40) in the next week or two, before peaking. Time is running out on the upward phase of this 72-day cycle, however, with its next trough due around early-October.
Going further, should the metal have a higher high in it near-term, then the 2630 figure (plus or minus 10 points) would be seen as a key resistance level, to the mid-term upward phase - which, as noted, is viewed as topping.
The 310-Day Cycle
Above the 72-day wave for Gold, there is a larger 310-day cycle, which last bottomed in October of 2023 - and is shown again on the chart below:
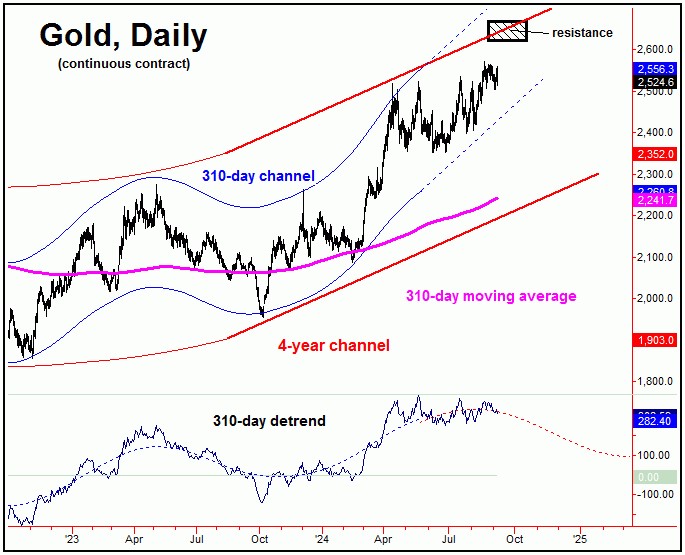
For the mid-term picture, this 310-day cycle is going over a much larger peak, with the next good correction phase expected to come from this wave. Once this wave does top out, the probabilities will favor a sharp correction playing out into the late-2024 to early-2025 window, with the 310-day moving average acting as the magnet - and with the lower four-year channel (in red) acting as mid-term support.
In terms of price, we are watching a key downside 'reversal point' for this 310-day cycle (which is not the same as the 72-day downside reversal point), which - when taken out to the downside - should confirm its next correction phase to be back in force, with exact details noted in our thrice-weekly Gold Wave Trader report.
In terms of patterns, the next correction phase of our 310-day cycle is favored to end up as a countertrend affair - holding above the prior 310-day low from back in October, 2023. If correct, the next rally phase of this 310-day wave should see a rise of some 20-25% for Gold, lasting well into next year - before topping a larger-tracked four-year wave.
Technical Signals
Lastly, there is a key momentum indicator that we track for the Gold market, which is our Gold Timing Index - and shown on the chart below:
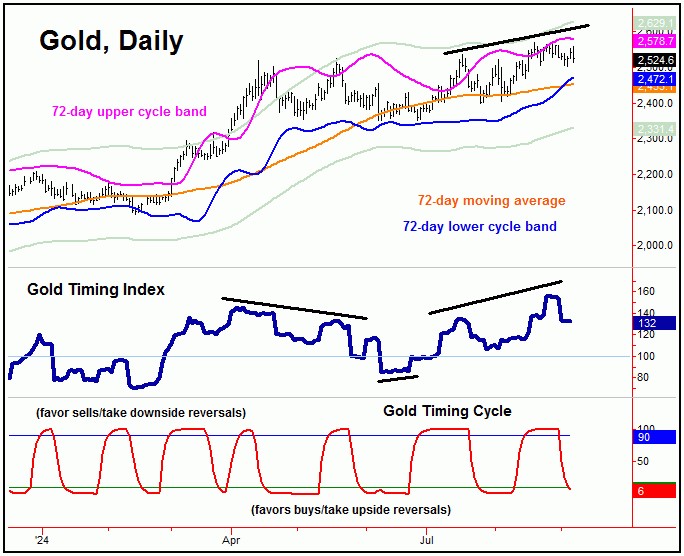
For the mid-term 72 and 310-day cycles, what we want to be on the lookout for are times when this Gold Timing Index registers a divergence from price action. This divergence was seen briefly back in late-August - though was negated in the days that followed. In other words, the indicator managed to push back to higher highs for the swing, which is viewed as bigger net positive.
Lastly, our Gold Timing Cycle indicator (lowest pane, in red) has dropped back below its lower reference line with the recent action. This is normally a bullish indication for the short-term view, and may be supportive of another stab at the highs in the coming weeks - before setting up our expected mid-term peak for the metal. Stay tuned.
Jim Curry
The Gold Wave Trader
Market Turns Advisory
http://goldwavetrader.com/
http://cyclewave.homestead.com/
********


