Gold Forecast: Gold Cycles Moving into the 'Kill Zone'
 share
share
 share
share
 share
share
 share
share
 share
share
 From my prior articles, we expected the last key low for Gold to form into the late-May to early-June timeframe - a move which was expected to end up as a countertrend affair. From there, the analysis called for new all-time highs to be seen into the late-July period or beyond, with the metal now setting up for its next mid-term price peak.
Gold's 72-Day Cycle
The 72-day cycle is currently the most dominant cycle in the Gold market, and is shown again on the chart below:
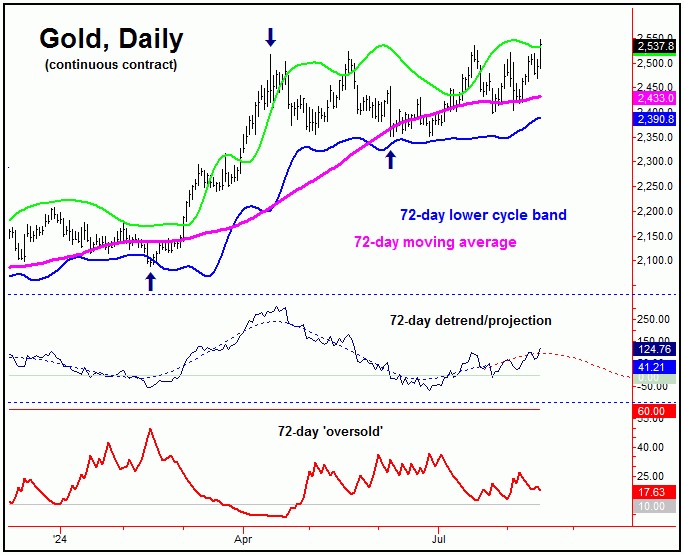
This 72-day cycle last bottomed out back in early-June of this year, a move which was favored to drop back to the 72-day moving average - but which was anticipated to end up as a countertrend affair. This did end up as the case, and with that the analysis called for a push back to new all-time highs into the late-July to mid-August window - which we are obviously seeing.
With the above said and noted, this 72-day wave is now some 50 trading days along from its last trough, and with that is into normal topping range. Its next bottom - if made on schedule - is due around the late-September period, plus or minus.
Having said the above, we can't just try and pick a high for the move. That is, there is still the potential for additional strength in the next week or two, with the low-end rallies with this wave having been about 10% off the bottom. In other words, there is the potential for a push on up to the 2586 figure before our 72-day cycle tops out.
The Bigger View for Gold
Above the 72-day wave for Gold, there is a larger 310-day cycle, which sets the mid-term trend for the metal.
Shown again below is that 310-day cycle:
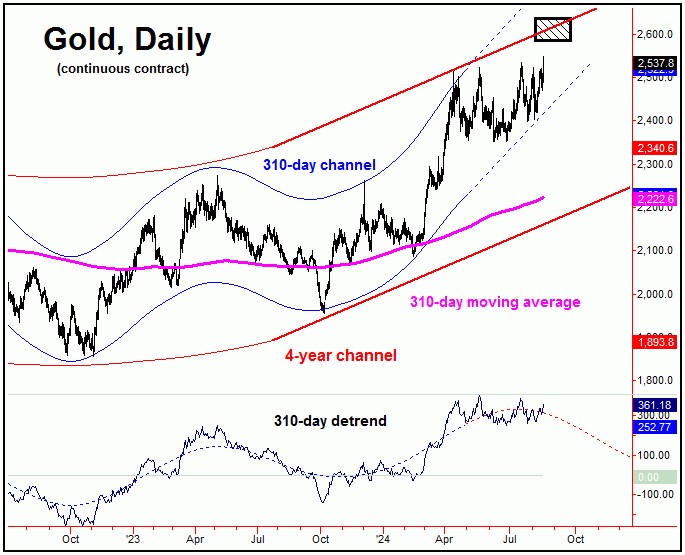
From the comments made back in the Autumn of last year, this 310-day wave had formed its low. That is, at a time when many pundits had given up on Gold, my analysis suggested that a rally of 20% or more was unfolding - ideally taking the metal sharply higher into the Spring/Summer of this year.
Having said the above - with everybody now bullish on the metal - this 310-day cycle is moving back into topping range. Going further, the current upward phase of our smaller 72-day wave is expected to peak this larger 310-day cycle, for what is expected to be a sharp correction in the coming months.
Even said, as mentioned earlier, this 72 and 310-day combination peak should come from higher price highs than already seen - though it is getting fairly close to forming, at least in regards to time.
Stepping back, from whatever peak that does form with our 72 and 310-day cycles, the probabilities will favor a sharp decline playing out in the months to follow - most likely into the late-2024 to early-2025 window.
In terms of price, the 310-day moving average (currently some 12% below current price levels) would be the ideal magnet to the next mid-term correction with Gold, with the lower (and rising) four-year cycle channel acting as key support.
In terms of patterns, the next correction phase of our 310-day cycle is anticipated to end up as a countertrend affair - holding above the prior 310-day trough, registered back in October, 2023, and with support around the aforementioned four-year cycle channel.
If the above is correct, a late-2024 to early-2025 bottom with our 310-day cycle should give way to another sharp rally (20%+) into next year, before eventually peaking a larger four-year cycle in Gold.
Technical Signals
With the above said and noted, there is a key momentum indicator that we track for the Gold market, which is our Gold Timing Index - and which is shown on the chart below:
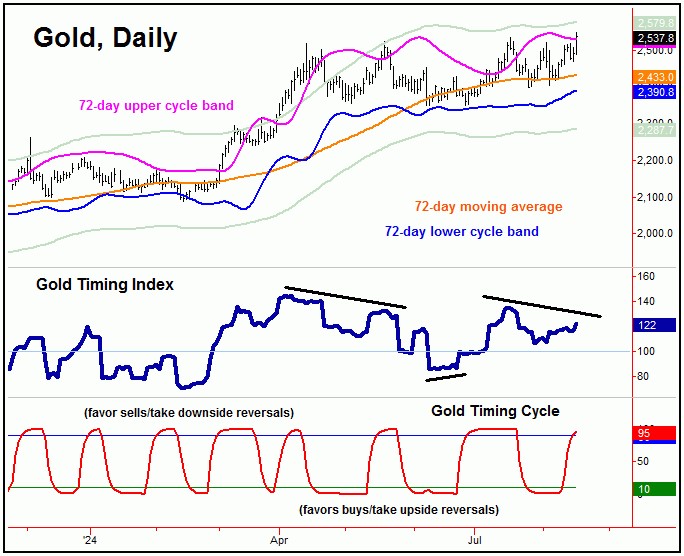
What we want to note with the above chart are times when our Gold Timing Index (middle pane, dark blue) registers a divergence from price action. This is the case right now, which is a technical warning signal. However, this divergence could always be negated in the days ahead, depending on the action.

The bottom line with Gold is that we are in the process of forming the next key price peak, one which has a decent amount of downside risk in the coming months - but a move which is expected to end up as a larger countertrend affair.
With the above said and noted, we do have a new downside 'reversal point' for our 72 and 310-day cycles. This number is an exact price figure, which - when taken out to the downside - will confirm our 72 and 310-day cycles to have topped, with exact details posted in our thrice-weekly Gold Wave Trader market report.
Jim Curry
The Gold Wave Trader
Market Turns Advisory
http://goldwavetrader.com/
http://cyclewave.homestead.com/
********
share
share
share
share
share