Gold Forecast: Gold Cycles Prepping for Coming Decline


 From my prior articles, the last good swing low for Gold came from our 72-day time cycle, which formed its bottom back in early-June. With that, this wave - as well as the mid-term 310-day cycle - is well into topping range, and with that is looking for a sharp decline to play out in the coming months.
With the above said and noted, we can take a look at the current status of the Gold cycles, to see where we are in the overall environment.
Gold's 72-Day Cycle
The 72-day cycle is the most dominant cycle in the Gold market, and is shown on the chart below:
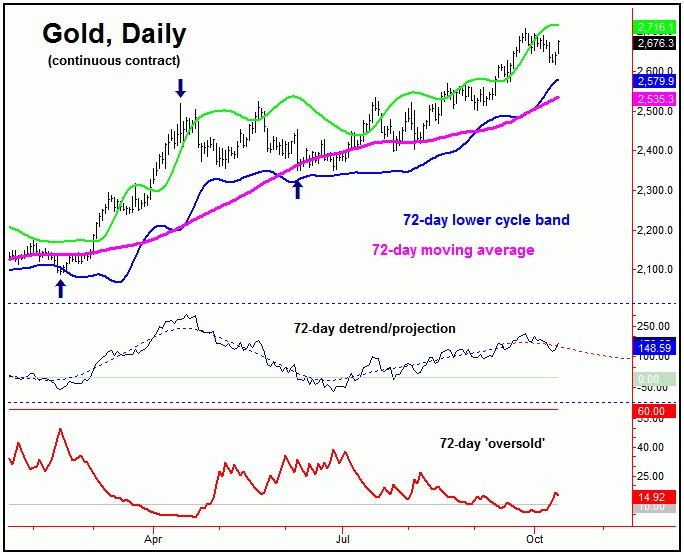
As noted in our Gold Wave Trader report back in June, the reversal above the 2408.10 figure 'triggered' (confirmed) the current upward phase of this 72-day cycle, which has seen a gain of nearly 300 points through that figure.
In terms of time, the current upward phase of this 72-day cycle is well into extended territory, and with that is set to top again at anytime. Once it does peak, a minimum drop back to the 72-day moving average would be expected, a normal retracement for this wave. In terms of time, our detrend that tracks this wave has re-adjusted its low, now projected for the late-October to mid-November window.
With the overall action, we are still long the GLD from back in June - though are looking for indications to exit that position in the days/weeks ahead.
One of the key technical signals that we track comes from our Gold Timing Index, which is shown on the chart below:
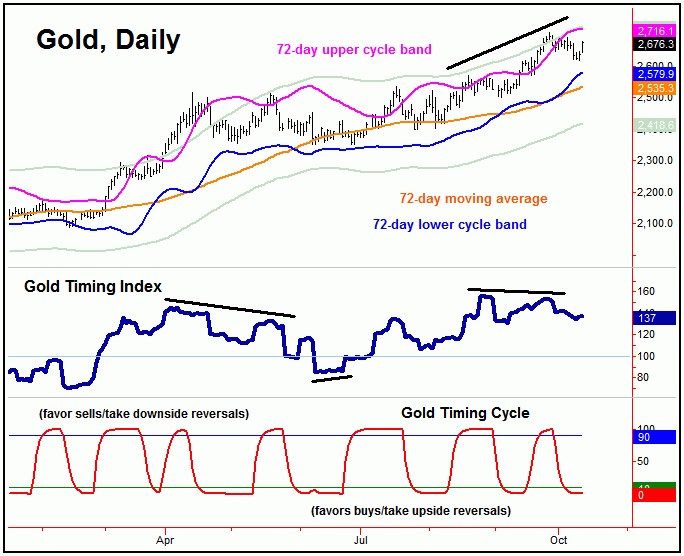
Our Gold Timing Index is a combined sentiment/momentum measure of the Gold market, and is the most important technical indicator that we track. It is a proprietary signal, available only in our Gold Wave Trader report.
What we look for at key mid-term peaks and troughs is for a divergence to form between the indicator and price. The last such divergence came back in April/May of this year, and forewarned of a peak forming - which we knew would come from the aforementioned 72-day time cycle. What followed was a correction back to the 72-day moving average into June - a decline of about 6.8% off the top.
With the most recent new price high, we have formed another divergence between the indicator and price, which is again warning of a key peak forming. Having said that, this time around, the expected peak should come from not only our 72-day wave, but a larger 310-day cycle as well - which sets the mid-term trend for Gold.
The 310-Day Cycle
Above the 72-day wave for Gold, there is the larger 310-day cycle, which last bottomed in October of 2023 - and is shown on the chart below:
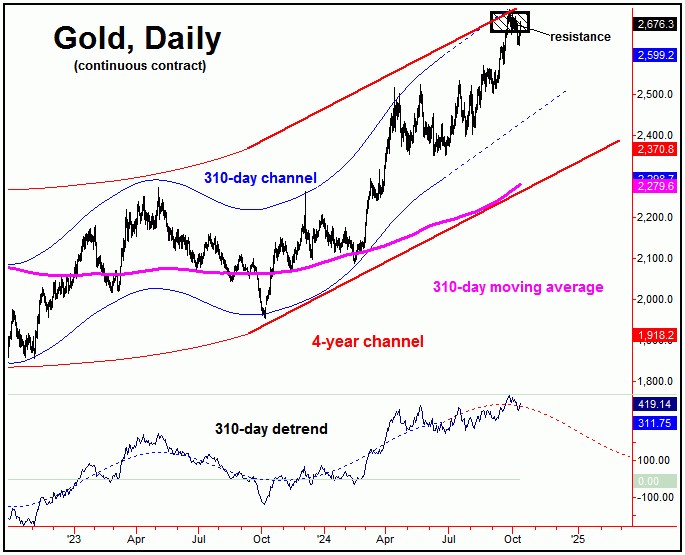
From the comments made some of my prior articles, this 310-day cycle is going over a peak, with the next mid-term correction phase expected to come from this wave. In terms of price, key resistance was noted as being near the upper four-year cycle channel for Gold, which the most recent highs have been testing.
Once this 310-day wave does top, the probabilities will favor a sharp correction playing out into what now looks to be the first few months of next year. In terms of price, the 310-day moving average would be a natural magnet to this correction, with the same now at or near the lower four-year cycle channel.
Going further with the above, the 310-day moving average and the lower four-year cycle channel would be key mid-term support for the Gold market, and would be favored to hold the coming mid-term decline phase - for what is expected to be a sharp (20%+) push higher into later next year - before topping a four-year cycle that we track (more on this in a future article).
In terms of price, we are watching a key downside 'reversal point' for this 310-day Gold cycle component which - when taken out to the downside - will confirm its next correction phase to be back in force, with precise details always noted in our thrice-weekly Gold Wave Trader report.
Jim Curry
The Gold Wave Trader
Market Turns Advisory
http://goldwavetrader.com/
http://cyclewave.homestead.com/
********
More from Gold-Eagle


