Gold Forecast: Gold & U.S. Stock Cycles Update


 As we move into the year 2025, I thought it would be a good idea to take a look at the configuration of the time cycles, for both the Gold market - as well as for U.S. stocks.
Gold, Short-Term
For the very short-term, until proven otherwise the upward phase of a dominant 10-day wave is seen as in force in the Gold market, with that cycle shown below:
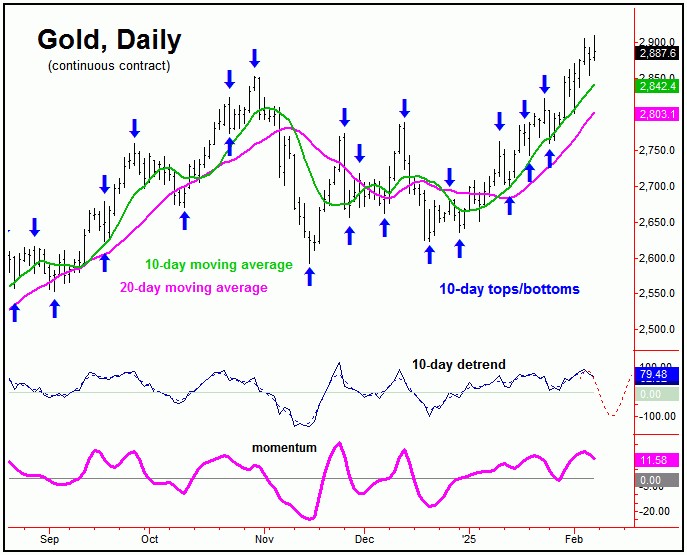
In terms of time, this 10-day wave is next projected to bottom in the coming days, with any reversal below the 2874.20 figure (April, 2025 contract) being the best confirmation it has peaked. In terms of price, that action would put the 10-day moving average as the ideal magnet, though with the potential for additional weakness through the same.
Stepping back further, of more key focus now is the bigger 72-day wave. As per my last article back in December, this 72-day cycle was confirmed to have bottomed out back in mid-November of last year, and with that was favored to push higher into the mid-January to early-February timeframe - which we are now into.
Here again is our 72-day cycle in Gold:
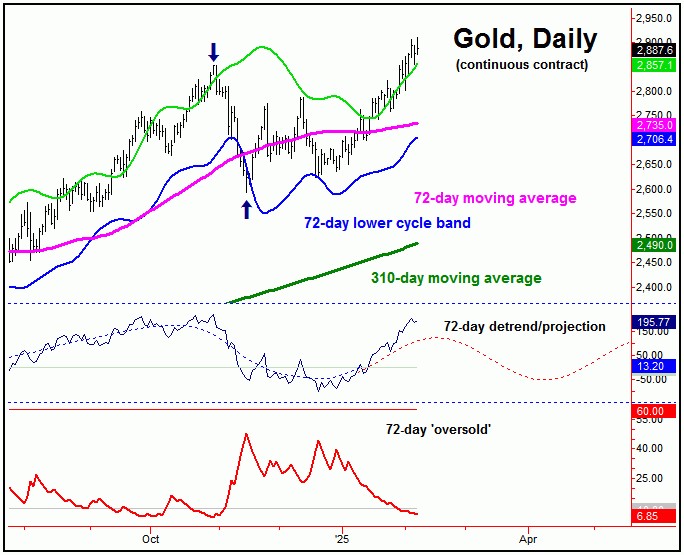
Once this 72-day wave tops out, its next bottom (as projected by our 72-day detrend indicator) is due around the early-April window, plus or minus. In terms of price, our downside 'reversal point' for this 72-day cycle is currently set at the 2795.80 figure (April, 2025 contract).
With the above said and noted, any push below the 2795.80 figure - if seen at any point going forward - would confirm this 72-day wave to have topped, thus putting the 72-day moving average and lower 72-day cycle band as the expected magnets. This downside reversal point number is moving up every few days, with the most current number always posted in our thrice-weekly Gold Wave Trader report.
With that, a countertrend correction with the 10-day cycle - if seen - would be expected to give way to a push back to or above whatever high that forms on the current upward phase. In terms of time, that would be favored to play out into mid-to-late February, which would then be the odds-on favorite to peak our larger 72-day component.
In terms of price, any short-term decline (such as with our aforementioned 10-day cycle) would need to remain above the 2795.80 figure, in order to keep the upward phase of the bigger 72-day cycle intact.
The Mid-Term View for Gold
From the comments made in my last article back in late-December, the assumption had been that the upward phase of our 72-day cycle would end up as countertrend, against the 2825.90 swing top from back in early-October. That peak was seen as our last top for the bigger 310-day wave, which is shown again on the chart below:
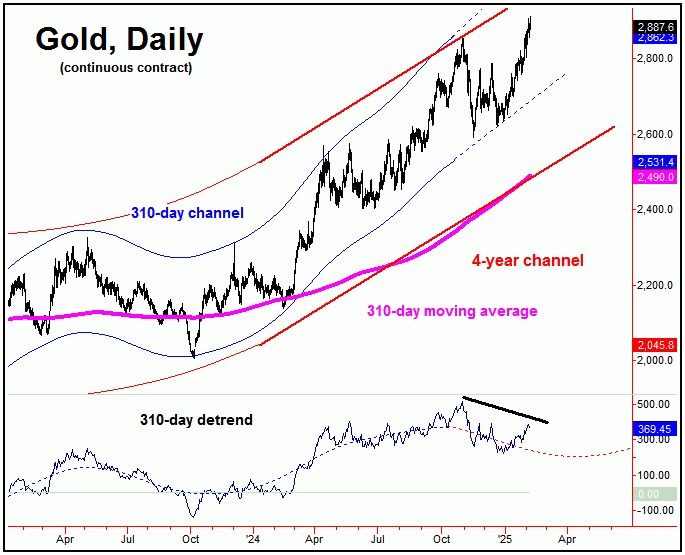
With Gold having taken out its early-October peak on the upward phase of our 72-day wave, that action now negates the downward phasing of our 310-day cycle. In other words, this particular cycle either bottomed very early - back in mid-November - or else is seeing some very extended upward phase, something of a rarity.
Adding to the notes above, if we look at our detrend that tracks this 310-day wave, we can see a good divergence having formed, which would support the idea of an extended cycle. Either way, prices can continue to extend higher for now, though - with the position of our smaller 72-day wave - any confirmed turn with that cycle would have decent odds of turning the bigger component.

For the bigger picture, I think the next mid-term buy for Gold will still come from a late-Spring, 2025 bottom, ideally made as close to the lower four-year channel as possible. In terms of patterns, that decline would be favored to end up as countertrend, before giving way to another 20%+ rally into later this year.
U.S. Stock Market, Mid-Term
For the mid-term picture in U.S. stocks, as mentioned in some of my prior articles, the 180 and 360-day time cycles were seen as pushing higher into the late-2024 to early-2025 region.
Here is the smaller 180-day cycle on the SPX:
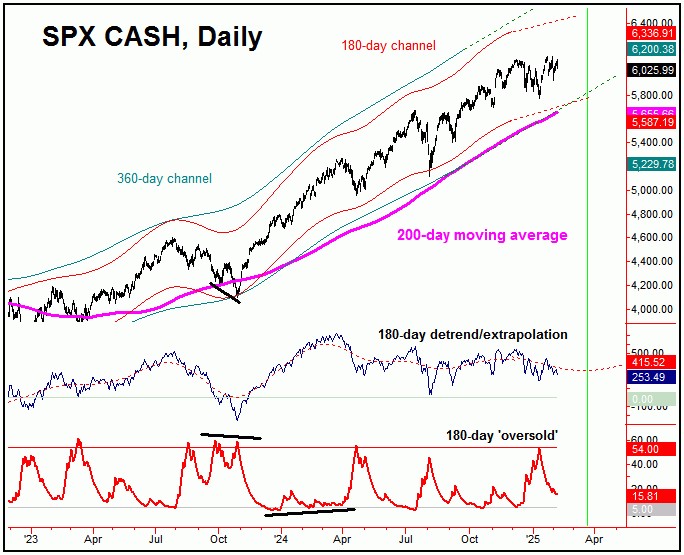
In terms of time, the next trough for our 180-day wave is projected for April, which is also the general timeframe for a bottom with the 310-day cycle in Gold. In terms of price, a normal correction with this 180-day wave in stocks will take prices back to the rising 200-day moving average - and may also provide key mid-term support for the SPX.
The Presidential Cycle
Going further with the above, we are currently in 'post-election' year with the presidential cycle, which suggests a late-February low - followed by another low around the early-April timeframe - which is in line with our assessment with the 180-day time cycle. Here is a chart of the post-election year path:
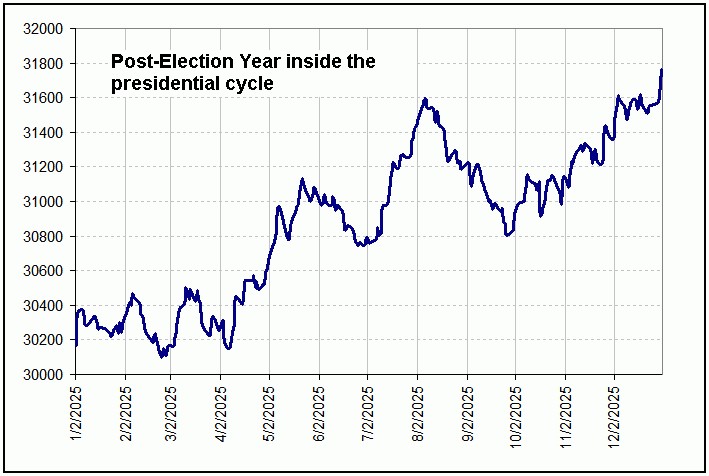
From a Springtime bottom, the post-election year pattern turns higher into mid-to-late Summer - a rally which could be as much as 17-20% off the Spring bottom, based upon an average rally with our 180-day time cycle. From a July/August peak, the post-election path shows weakness into early-Autumn, before turning higher again into year-end. More on all as we continue to move forward.
Jim Curry
The Gold Wave Trader
Market Turns Advisory
http://goldwavetrader.com/
http://cyclewave.homestead.com/
********


