Gold Forecast: Gold's Mid-Term Picture Remains Up

Last week's trading saw Gold holding weaker into mid-week, with the metal forming its low in Wednesday's session with the tag of the 1908.40 figure. From there, however, a sharp rally was seen into Thursday, here pushing all the way up to a high of 1987.00 - before consolidating the action into Friday.
The Mid-Term Viewpoint
For the mid-term picture, gold was due for a series of correction phases - with the first one currently in force. Having said that, the overall assessment favors the weakness off the 2089 swing high to end up as a countertrend affair. If correct, then we are likely in the midst of an Elliott wave '4', one which will give way to a wave '5' in the coming months, before topping the larger swing.
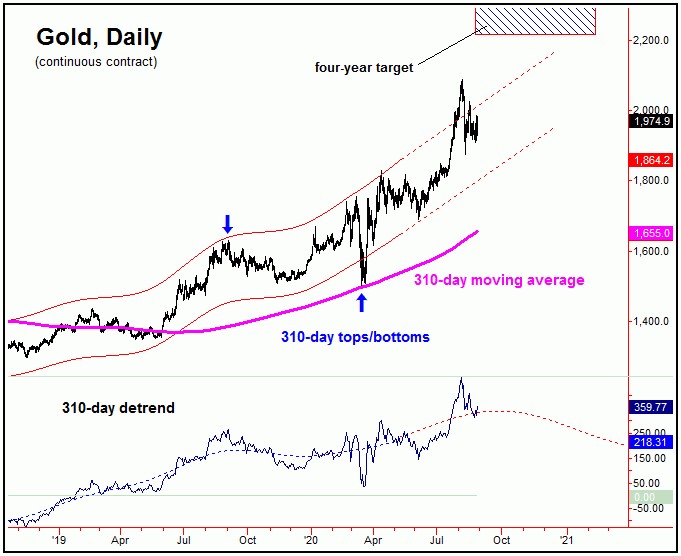
Take a look at the chart below:
The chart above again shows our 310-day cycle, which is a mid-term component - and one which is of a key focus in the coming months. In other words, the next mid-term peak - and decline phase - should come from this particular wave.
In terms of price, it was back in July that our four-year time cycle had confirmed a larger upside target for Gold, which is to the 2212.00 - 2340.56 region. We have seen in the past that these targets have an 85% probability of being hit, and with that the natural assumption is that the metal is headed up into this price zone at some point in the coming months. This is something not to lose focus of, as the cyclic targets tend to override any of the shorter-term expectations.
Going further, our 310-day chart offers up some key additional information. That is, the channel that encloses the action comes from this same 310-day cycle, and - for this channel to remain pointing higher - any price decline would need to hold at the bottom of the same (plus or minus). The bottom of this 310-day cycle channel is currently around the 1830's for gold (December, 2020 contract). In other words, if this level should be tested at any point going forward, it would be the most ideal re-entry for the long side of the market.
Of course, with our 310-day wave currently pointing higher into later this year, there is no guarantee that prices will correct back to the bottom of the aforementioned channel. In other words, there is no requirement that a drop back to the lower channel line be seen at any point, at least until the cycle itself actually tops and turns south. We do anticipate that eventually being seen, though not until sometime until early next year.
The Larger View for Gold
From the comments made in past articles, the next decline phase from the 310-day cycle will likely be the largest percentage drop in gold since the decline into the August, 2018 major low, which was also our prior trough for the larger four-year cycle. In terms of patterns, however, that decline is expected to end up as countertrend, likely coming in the form of a 50-61% retracement of the entire rally from the August, 2018 trough to whatever peak that ends up forming with this 310-day wave.
In other words, the mid-term action favors higher highs into later this year, then to be on the technical lookout for the next mid-term peak - expected to come from this 310-day wave. Our 310-day target zone (2212.00 - 2340.56) will also act as a major resistance level to this rally, and is the early odds-on favorite to top the same for a correction into the Spring of 2021, with more precise details noted in our thrice-weekly Gold Wave Trader report.
Technical Indications
From the comments made in prior articles, our Mid-Term Breadth index began to register a divergence back in late-July, and with that warned of a coming decline. Here again is our chart, showing this indicator:
This same technical divergence between price and breadth was seen back in February, and which led to the sharp 160 point drop into the March bottom - and which ended up as our last mid-term trough, for the aforementioned 310-day time cycle.
On the chart above, we can see the decent retracement with Mid-Term Breadth, with the drop putting the indicator in range of prior bottoms. Even said, it is also pointing south at the present time, and - until it turns back to the upside - there is still the potential for additional short-term weakness. On the flip side, we will be watching closely for signs of a turn in the same in the days/weeks ahead, as the next turn to the upside in breadth should support our expected run into the 2212.00 - 2340.56 target zone - before setting up the next mid-term peak in gold prices. More on all as we continue to move forward.
Jim Curry
The Gold Wave Trader
http://goldwavetrader.com/
http://cyclewave.homestead.com/


