Gold Gets Close, But No Cigar
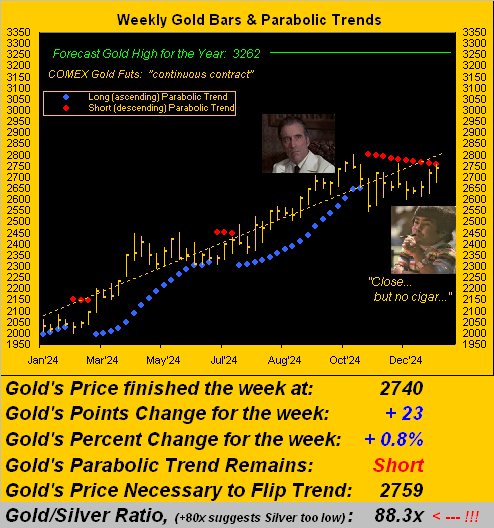
“So near and yet so far.” So says Nick-Nack to Francisco Scaramanga, –[“The Man with the Golden Gun”, Eon/UA, ’74]. So quintessentially perfect, too, does it describe Gold’s rally this past week wherein price on Thursday came within just five points (at 2758) of eclipsing the weekly parabolic Short trend level of 2763 which would have flipped said trend to Long. But instead, price then faltered to 2729, still to rebound yesterday (Friday) up to within four points (at 2759), only to then again sink back in settling the week at 2740. Thus the still ongoing Short trend just completed its tenth consecutive red-dotted week per this chart of Gold’s weekly bars from one year ago-to-date:

Acknowledgedly, ’twas just a week ago that we wrote “Gold’s Short Trend Nearing Its End”, and indeed as now noted, how close price came to the 2763 parabolic hurdle. But as we therein duly penned: “…until the present Short trend actually confirms having flipped to Long, Short remains Short…” And whilst Gold actually has mildly risen through most of this Short trend, those rightmost red dots above have basically been a slanting roof over price. However: the good news for this ensuing week is the nearby opportunity for Gold’s trend to finally flip from Short to Long per the following graphic. Depicted are Gold’s 60-minute (one-hour) candles for the entirety of this past week. Note the two green horizontal lines: the upper one is the 2763 level Gold needed to attain to flip the trend … again, price got close but no cigar; but the lower green line is the new 2759 level necessary to achieve the flip in this ensuing week. And given Gold’s range statistics in the black box, 2759 is well within reach:
“But you just repeated ‘Short remains Short’ and that does look like a double-top, huh mmb?”
Squire ever so enjoys brandishing his technical chapeau at times, and you can see in the above chart his “double-top” observance which oft sends markets lower. To be sure, were Gold to have a “straight down” week, the Short trend remains in place. But being just 19 points from the Longside threshold as the week unfolds — given an expected weekly trading range of 87 points — the mere ebb and flow of dough “ought be” enough for Gold to trade above 2759 within a week’s time. Moreover should that occur, yet Gold then go on to record a down week, the trend would nonetheless already have flipped to Long. But until that confirmingly takes place, we shan’t rule out further downside toward (as we’ve written) the upper 2400s … yet hardly shall we root for such.
Now as we work toward addressing the Economic Barometer, let’s briefly assess inflation, which if indeed perking up can initially retard Gold’s upward path. And this past week, the FinMedia hysteria was palpable: on the heels of Tuesday’s leading read of December wholesale inflation (Producer Price Index) — the pace of which encouragingly slowed — Dow Jones Newswires looked toward Wednesday’s retail read (Consumer Price Index) with “Stock Investors brace for possibly the ‘most important inflation reading in recent memory'” in quoting an SWBC analyst. Then upon the retail release, Bloomy followed up with “Wall Street Sees Best CPI Day Since October 2023”. Wrong. (Do they no longer employ editors at Bloomy?) December’s +0.4% CPI pace was the most since that for last March; or assuming neither you eat nor drive, the “core” pace of +0.2% — whilst off a pip from November’s +0.3% read — matched that of both May’s and July’s paces. But as alluded to a week ago, this is what you get when human headlines are replaced with those generated by “AI” (“Assembled Inaccuracy”).
Fortunately — assuming you do your own math and analysis — you don’t make investment/trading decisions from FinMedia fodder. Still, with respect to inflation, we’re nearly two weeks away from December’s “Fed-favoured” Personal Consumption Expenditures readings, which due 31 January come two days after the next Policy Statement from the Federal Reserve’s Open Market Committee … (but does the Bureau of Economic Analysis tip them off? Just a thought…)
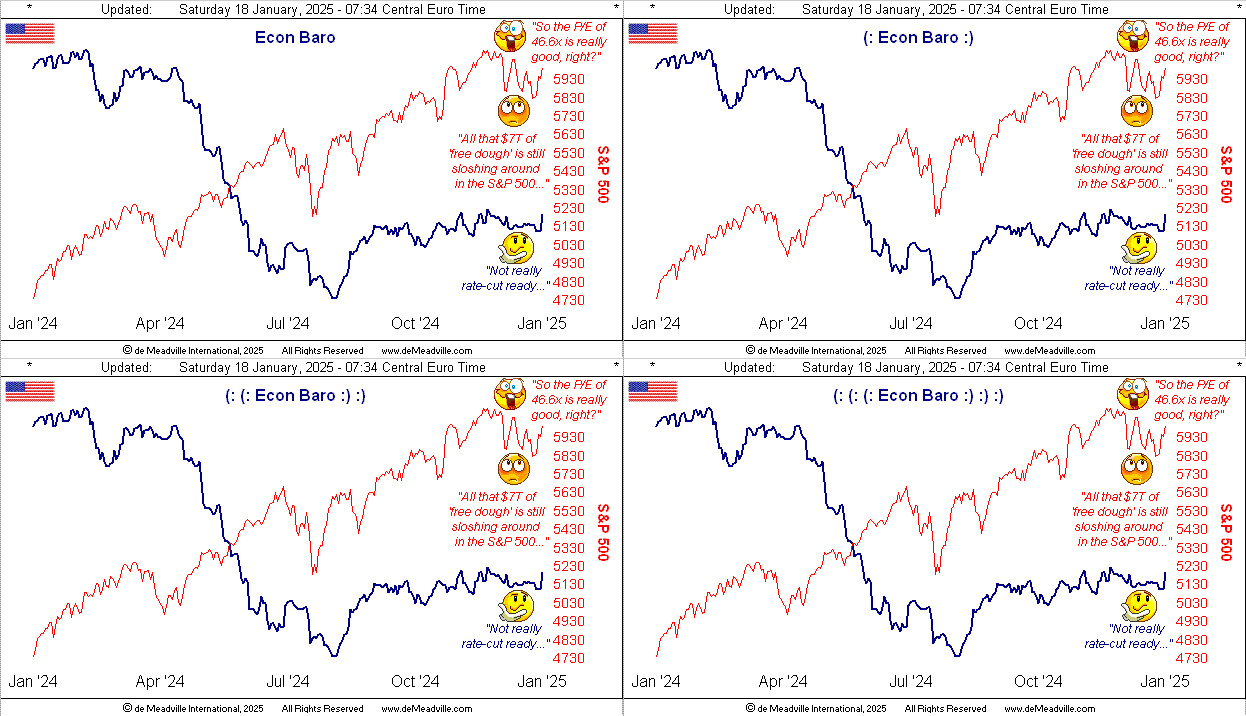
As to thinking on the Econ Baro, the past week’s robust stream of 18 incoming metrics were on balance positive. Notable improvements were recorded for January’s Philly Fed Index along with December’s Housing Starts, Industrial Production and Capacity Utilization: all four of those metrics posted period-over-period growth, were revised higher from their prior readings, and beat their respective consensii.
Still, growth in Retail Sales slowed. Also, Initial Jobless Claims increased, were worse than consensus, and the prior week’s number was revised higher, (perhaps a function of folks first finishing New Year’s partying before searching for a job to pay for the credit card’s having financed it all). But net-net, the Baro got a boost, which in turn likely leaves the Fed to sit on its hands rather than see its FundsRate come 29 January further loosed:

Truly getting a boost even within its weekly parabolic Short trend is Gold as we turn to the two-panel display of daily bars from three months ago-to-date for the yellow metal on the left and white metal on the right. ‘Tis important to note that Gold’s baby blue dots of trend consistency have just risen above their key +80% axis: upon their inevitably dropping beneath same, one must then be wary for lower price levels; but hopefully by then the parabolic trend shall already have flipped to Long toward limiting any substantive downside demise. Silver’s like recent rally has been less robust than that for Gold: thus came the past week’s rise in the Gold/Silver ratio from 86.8x to 88.3x; again with the century-to-date average ratio being 68.7x, Sister Silver remains cheap!
And for the precious metals’ 10-day Market Profiles, here we’ve those for Gold (below left) and for Silver (below right). Obviously with Gold having had the better rally of late, we find present price (2740) higher up in its Profile than is that for Silver (31.05):
As to Gold’s price stack, here ’tis:
The Gold Stack
Gold’s Value per Dollar Debasement, (from our opening “Scoreboard”): 3817
Gold’s All-Time Intra-Day High: 2802 (30 October 2024)
2024’s High: 2802 (30 October 2024)
Gold’s All-Time Closing High: 2799 (30 October 2024)
The Weekly Parabolic Price to flip Long: 2759
10-Session directional range: up to 2759 (from 2627) = +132 points or +5.0%
Trading Resistance: notable nearby Profile nodes 2748 / 2755
Gold Currently: 2740, (expected daily trading range [“EDTR”]: 34 points)
Trading Support: 2739 / 2725 / 2718 / 2705 / 2686 / 2682
10-Session “volume-weighted” average price magnet: 2697
The 300-Day Moving Average: 2371 and rising
The 2000’s Triple-Top: 2089 (07 Aug ’20); 2079 (08 Mar’22); 2085 (04 May ’23)
2024’s Low: 1996 (14 February)
The Gateway to 2000: 1900+
The Final Frontier: 1800-1900
The Northern Front: 1800-1750
On Maneuvers: 1750-1579
The Floor: 1579-1466
Le Sous-sol: Sub-1466
The Support Shelf: 1454-1434
Base Camp: 1377
The 1360s Double-Top: 1369 in Apr ’18 preceded by 1362 in Sep ’17
Neverland: The Whiny 1290s
The Box: 1280-1240
And so to close with another FinMedia alert so eloquently put, again courtesy of DJNw, this from last Tuesday: “The 10-year Treasury yield is nearing 5% again. Why stock investors are freaking out”. ‘Course the inference there goes back to the two years prior to the FinCrisis. Indeed for seven of the 16 months spanning from April 2006 into July 2007, the 10-year yield reached above 5%, albeit the S&P 500 rose right through that period (+20% from 1295 to as high as 1556). Then it all went wrong — not because of a 5% yield — but rather due to lack (understatement) of lending standards.
Still, many modern-day stock investors don’t know what ’tis to truly be “freaking out”. They’ve yet to experience the “Look Ma! No Earnings!” crash, given the current “live” price/earnings ratio of the S&P 500 (now 46.6x) eventually reverting to its 68-year evolving mean; (for those of you scoring at home, that suggests a -50% S&P correction). Too, there’s the even scarier “Look Ma! No Money!” crash, given the current $52.9T S&P 500 market capitalization being supported by a liquid StateSide money supply [“M2”] of “only” $21.7T; (for you WestPalmBeachers down there, that means there’s more than twice as much money invested in the stock market than readily exists).
So fire up a stogie and be prepared to follow your monetary star…

…such that you’re not spared a Gold bar and cigar!
Cheers!
…m…
www.TheGoldUpdate.com
www.deMeadville.com
and now on “X”: @deMeadvillePro
********


