Gold Glimmers as Global Market Fear Grips Investors
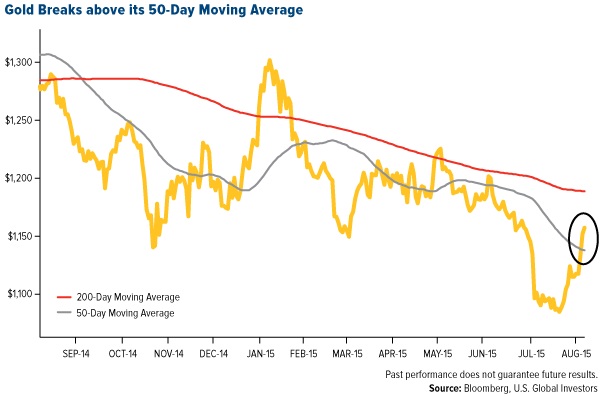
Gold last week broke above its 50-day moving average as a fresh round of negative news from around the globe rekindled investors’ interest in the yellow metal as a safe haven. The Fear Trade, it seems, is in full force.

Below are just a few of the recent news items that have made some investors skittish, which has supported gold prices:
- China, the world’s second-largest economy, continues to slow. Its preliminary purchasing managers’ index (PMI) reading, released on Friday, came in at 47.8, a 77-month low. This follows China’s decision to devalue its currency, the renminbi, close to 2 percent. For the first time in a year, the Shanghai Composite Index fell below its 200-day moving average.
- Crude oil is on an eight-week losing streak, the longest in 29 years. West Texas Intermediate (WTI) slipped below $40 per barrel in intraday trading Friday, the first time it’s done so since 2009.
- U.S. stocks are undergoing an ugly selloff. They just had their worst week since September 2011 and are on track to post their worst month since May 2012. The Dow Jones Industrial Average, down 10 percent since its all-time high, is nearing correction territory. All 10 S&P 500 Index sectors were off last week.
We can also add to this list the high levels of margin lending on the New York Stock Exchange (NYSE) right now. At the end of every month, the exchange discloses margin amounts, and it appears that everyone is leveraged. Real margin debt growth since 1995 is twice as much as real S&P 500 growth.

Cartson Ringler is a market analyst and founder of Ringler Consulting and Research in Germany. Speaking with the Gold Report this week, he highlighted the precariousness of high margin debt in domestic equities:
We saw a huge bull market from 2009 to 2015 on the S&P 500 when it went to around 2,080 from 666. That market is really mature. One number that scares me is the high margin debt on NYSE. When the big market crash happened in 1987, we saw $38 billion in margin debt, but as of June 2015, NYSE margin debt was more than $504 billion. Everyone is dancing until the music stops. So I’m shorting the S&P 500, while building my basket of different precious metals producers.
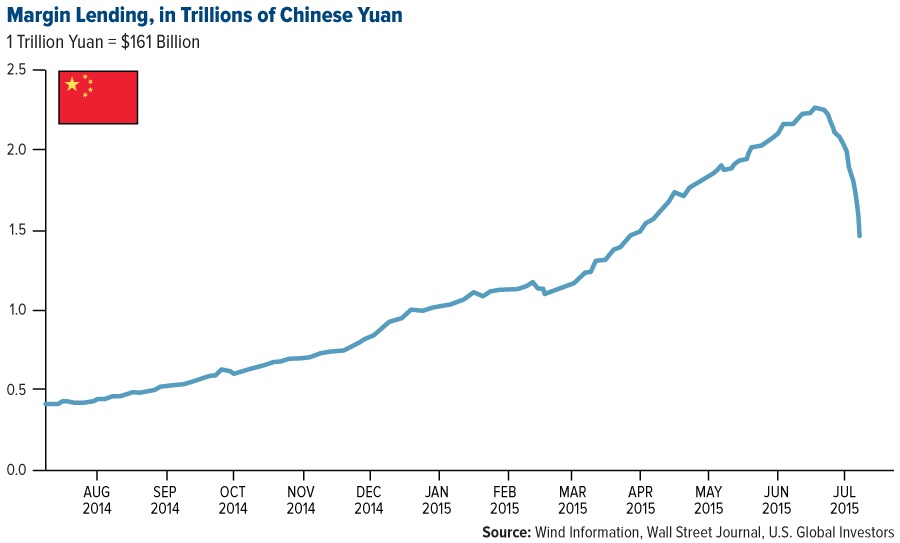
Should the $504 billion—an all-time high, by the way—worry us, as Ringler suggests? Maybe, maybe not. It’s worth remembering, though, that high margin lending in China greatly contributed to the Shanghai Stock Exchange’s 30-percent correction just a month ago.
In its Friday newsletter, Kitco made note of many of these market-moving events and said that “optimism in gold should spill over next week. A strong majority among retail investors and market professionals expect to see higher prices the last full week of August.”
The Contrarian Case for Gold Is Scorching Hot
Earlier this month I shared with you that hedge funds are net short gold for the first time since U.S. Commodity Futures Trading Commission data began in 2006. Being short has become a very crowded trade, and many contrarian investors have seized upon this bearishness to add to their gold exposure. American Eagle gold coin sales rose an impressive 124 percent in July month-over-month.
Last week, famed hedge fund manager Stanley Druckenmiller plunked down more than $323 million of his own money into a gold ETF, according to second-quarter regulatory filings.
Druckenmiller is the guy who consistently delivered 30 percent on an average annual basis between 1986 and 2010, the year he closed his fund to investors. He’s also responsible for making the call to short the British pound in 1992, which “broke the bank of England” because it forced the British government to devalue and withdraw the currency from the European Exchange Rate Mechanism (ERM).
And now he’s made a huge bet on gold. The $323-million investment, in fact, is the largest position in his family fund.
Demand among global central banks and retail buyers has also heated up. As I told Daniela Cambone in last week’s Gold Game Film, the Chinese government is now reporting monthly on its gold consumption to offer greater transparency and convince the International Monetary Fund (IMF) that the renminbi should be included as part of the special drawing rights. Last month, the Asian country purchased 54 million ounces. And in the first half of the year, demand in Germany, the third-largest gold market behind China and India, increased 50 percent over the same period in 2014.
Gold in Russian Ruble Terms Shows The Value of Hard Assets
The Russian ruble, meanwhile, has lost nearly 50 percent of its purchasing power from 12 months ago, following its invasion of Ukraine and the drop in oil prices. Over the same period, gold has risen about 54 percent.

It shows that when a currency loses value and falls out of favor, gold has tended to benefit as investors seek real assets. Gold prices have then been able to soar, just as we saw in the months following the financial crisis, eventually reaching an all-time high of $1,921 per ounce in September 2011.
Remember, Druckenmiller just invested heavily into gold. Prudent investors such as him understand the dynamic between fiat currencies and gold, and they adjust their funds accordingly. Does he predict something happening to the U.S. dollar that might benefit gold?
Druckenmiller might have 20 percent allocated to gold, but it’s advisable to have closer to 10 percent—5 percent in gold stocks, 5 percent in bullion, then rebalance every year. This should be strongly considered whether the economy is soaring or struggling.
I invite you to head over to Kitco and compare for yourself the price of gold in U.S. dollars to other world currencies.
Looking for Other “Safe Haven” Options in the Volatile Market?
Gold is indeed glimmering with safe haven appeal, but I encourage investors seeking an investment that has a history of less drama to check out municipal bonds. Our Near-Term Tax Free Fund (NEARX) invests heavily in high-quality munis that are on the short-end of the curve, ideal for when there’s interest rate uncertainty.
Having provided investors with over 20 straight years of positive returns, NEARX holds five stars overall from Morningstar, among 185 Municipal National Short-Term funds as of 6/30/2015, based on risk-adjusted return.
Air Traffic Demand Continues Its Upward Ascent
On a final note, Jeffries released its latest air traffic demand growth numbers yesterday, and the results were very positive. According to the group:
The July Jefferies Air Traffic survey registered a 6.4-percent year-over-year growth rate for our sample. The IATA (International Aviation Transport Association) report for July could show traffic growth of about 8.5 percent, strong vs. 5.9 percent year-to-date. Financial market turmoil and weak commodity prices don’t appear to be hurting demand.
July demand is up from 4.8 percent in June, Jefferies also notes. The strong traffic results serve as further justification for the group’s year-end demand growth estimate of 6 percent.
Please consider carefully a fund’s investment objectives, risks, charges and expenses. For this and other important information, obtain a fund prospectus by visiting www.usfunds.com or by calling 1-800-US-FUNDS (1-800-873-8637). Read it carefully before investing. Distributed by U.S. Global Brokerage, Inc.
|
Total Annualized Returns as of 6/30/2015: |
|||||
|
Fund |
One-Year |
Five-Year |
Ten-Year |
Gross Expense Ratio |
Expense Cap |
|
Near-Term Tax Free Fund |
1.88% |
2.48% |
3.04% |
1.08% |
0.45% |
Expense ratio as stated in the most recent prospectus. The expense cap is a contractual limit through April 30, 2016, for the Near-Term Tax Free Fund, on total fund operating expenses (exclusive of acquired fund fees and expenses, extraordinary expenses, taxes, brokerage commissions and interest).Performance data quoted above is historical. Past performance is no guarantee of future results. Results reflect the reinvestment of dividends and other earnings. For a portion of periods, the fund had expense limitations, without which returns would have been lower. Current performance may be higher or lower than the performance data quoted. The principal value and investment return of an investment will fluctuate so that your shares, when redeemed, may be worth more or less than their original cost. Performance does not include the effect of any direct fees described in the fund’s prospectus which, if applicable, would lower your total returns. Performance quoted for periods of one year or less is cumulative and not annualized.
Bond funds are subject to interest-rate risk; their value declines as interest rates rise. Though the Near-Term Tax Free Fund seeks minimal fluctuations in share price, it is subject to the risk that the credit quality of a portfolio holding could decline, as well as risk related to changes in the economic conditions of a state, region or issuer. These risks could cause the fund’s share price to decline. Tax-exempt income is federal income tax free. A portion of this income may be subject to state and local taxes and at times the alternative minimum tax. The Near-Term Tax Free Fund may invest up to 20% of its assets in securities that pay taxable interest. Income or fund distributions attributable to capital gains are usually subject to both state and federal income taxes.
The S&P 500 Stock Index is a widely recognized capitalization-weighted index of 500 common stock prices in U.S. companies. The Dow Jones Industrial Average is a price-weighted average of 30 blue chip stocks that are generally leaders in their industry. The Shanghai Composite Index (SSE) is an index of all stocks that trade on the Shanghai Stock Exchange.
The Purchasing Manager’s Index is an indicator of the economic health of the manufacturing sector. The PMI index is based on five major indicators: new orders, inventory levels, production, supplier deliveries and the employment environment.
All opinions expressed and data provided are subject to change without notice. Some of these opinions may not be appropriate to every investor. By clicking the link(s) above, you will be directed to a third-party website(s). U.S. Global Investors does not endorse all information supplied by this/these website(s) and is not responsible for its/their content.
********


 Frank Holmes is the CEO and Chief Investment Officer of


