Gold: Healthy Pullback Already Over


We had anticipated that the last US interest rate decision in mid-December would bring a bottom and an upward trend reversal in the gold market. Indeed, gold marked the end of its nearly two-month correction precisely on December 18th, 2024, with a low of USD 2,585. Subsequently, since the beginning of the year, gold bulls have clearly taken charge again, driving gold prices upward at a breathtaking pace.
Review
Initially, the all-time high from late October at USD 2,790 was surpassed without much resistance. A new all-time high of USD 2,942 was finally marked three weeks ago. Around USD 2,940, for the first time in almost two and a half months, more sellers than buyers appeared, causing the gold price to record a small double top and consolidate around the psychological mark of USD 2,900 for about a week. However, during the following trading week, the bulls managed another breakout to a new all-time high of USD 2,956. Overall, this represented an increase of 12.50% since January 1, 2025.
Massive gold transfers to New York spark supply shortages and delivery delays in London
This strong upward movement was favored by numerous factors, with the shift of large amounts of physical gold from London to New York apparently playing a crucial role. As a result, the London gold market is currently facing significant challenges. In January alone, 151 tons were withdrawn from London vaults. In the last two months, even 12.2 million ounces of gold were shipped to COMEX warehouses in the US.
This trend has led to a shortage of physically available gold in London, resulting in delivery delays. Waiting times for gold withdrawals from the Bank of England’s vaults have extended from a few days to four to eight weeks. This situation was exacerbated by the increasing demand for gold as a safe haven, driven by geopolitical tensions and inflation fears, as well as the buying frenzy in China at the beginning of the Chinese New Year (Year of the Snake). At the same time, the long delivery times are arousing mistrust.
A main reason cited for the massive relocation of gold stocks from London to New York was primarily the fear of possible new US trade tariffs on precious metals. The audit of US gold reserves announced by the Trump administration could also be a possible reason. Additionally, large financial institutions regularly exploit price differences between trading venues to profit from arbitrage transactions. Moreover, it’s entirely possible that the Trump administration is working on a new financial system backed by gold in some form.
In any case, this massive shift has led to a critical supply situation in London. According to the London Bullion Market Association (LBMA), the available gold stocks at the end of January were approximately 8,535 tons. Even if the “unallocated” gold is actually just not in the right size at the right place, the LBMA’s statement failed to reassure market participants.
Gold rebounds swiftly after deep but brief pullback
In the last trading week, which was characterized by the roll-over of the February future contract and the month-end price, the bears managed to successfully defend the important resistance zone around USD 2,955. Ultimately, the overheated gold price was pushed down in two stages from USD 2,956 to below the USD 2,900 threshold and finally to USD 2,832 within five trading days.
During the current week, however, gold has already recovered about USD 100, rising to USD 2,930ish. With this “v-shaped recovery,” the pullback, which has so far been considered healthy, is probably already over. The chances for a continuation of the rally clearly outweigh.
Chart Analysis – Gold in US-Dollar
Weekly chart: Pullback arrives after eight green weekly candles
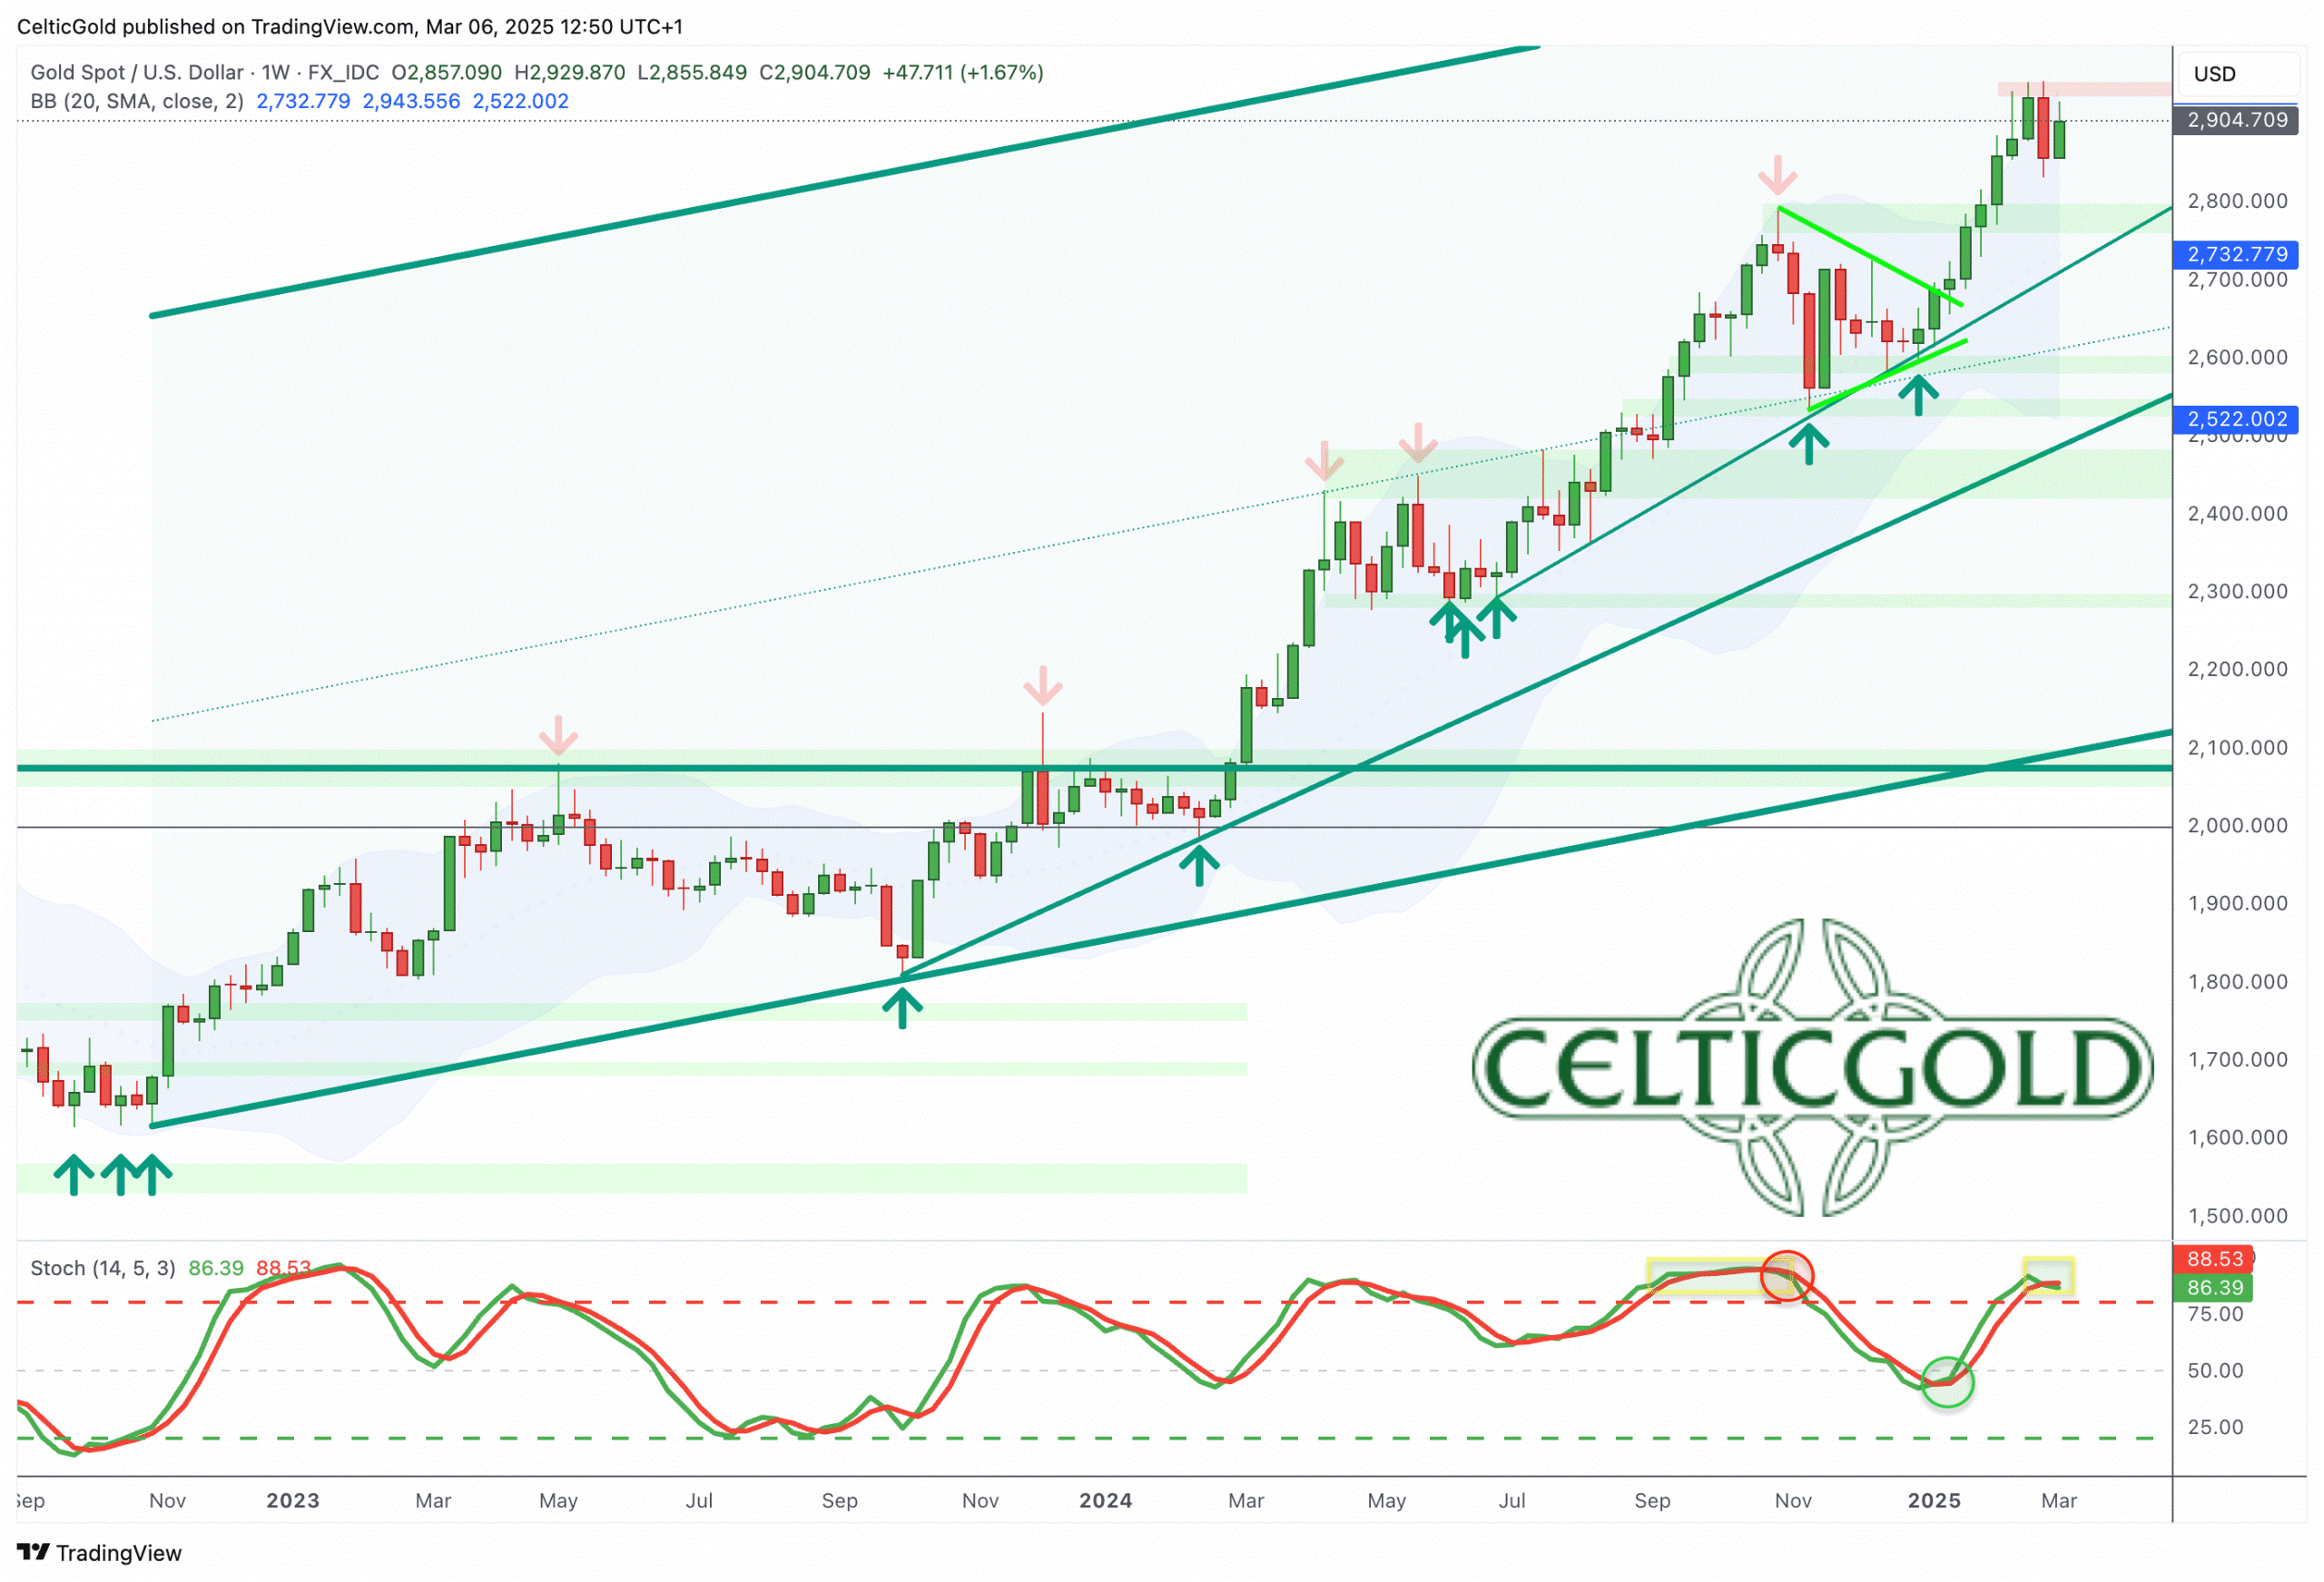
Gold in US-Dollar, weekly chart as of March 6th, 2025. Source: Tradingview
The healthy pullback from the high of USD 2,790 on October 31st, 2024, found its low at USD 2,535 as early as November 14th. However, the correction stretched out over time, with a slightly higher low of USD 2,585 reached on December 18th. Overall, the consolidation triangle took about two and a half months to form.
As expected, this triangle was resolved to the upside on January 15th, 2025, with a breakout above USD 2,675. Subsequently, gold knew no bounds. First, the all-time high of USD 2,790 was surpassed without significant resistance. Thereafter, gold continued to surge almost daily, eventually reaching a new all-time high of USD 2,956.
Recent pullbacks test resistance, but bullish momentum persists in gold’s uptrend
Only over the last three weeks did the resistance zone between USD 2,942 and USD 2,956 cause two sharp pullbacks towards USD 2,864 and USD 2,877, as well as a hefty sell-off back to USD 2,832. This has at least interrupted the impressive rally on the weekly chart after eight consecutive green weekly candles.
So far, the technical damage remains very limited. Although the weekly stochastic has been in overbought territory since the end of January, there are (still) no signals for an immediate end to the upward movement. Rather, the weekly stochastic continues to move in a bullishly embedded state.

The potential for a larger correction would naturally exist after the strong rise of the last two and a half months. However, since silver has not yet made its presence felt, we assume that the recent new all-time high (USD 2,956) from 10 days ago is not a significant peak!
Overall, the weekly chart remains bullish and still suggests a rise above USD 3,000 as the primary scenario. However, a weekly closing price below USD 2,790 would change a trend change. In that unlikely case, gold would have completed a top formation above USD 2,900 in recent weeks. Nevertheless, above the broad support zone between USD 2,865 and USD 2,890, the overall picture remains clearly bullish.
Daily chart: V-shaped recovery
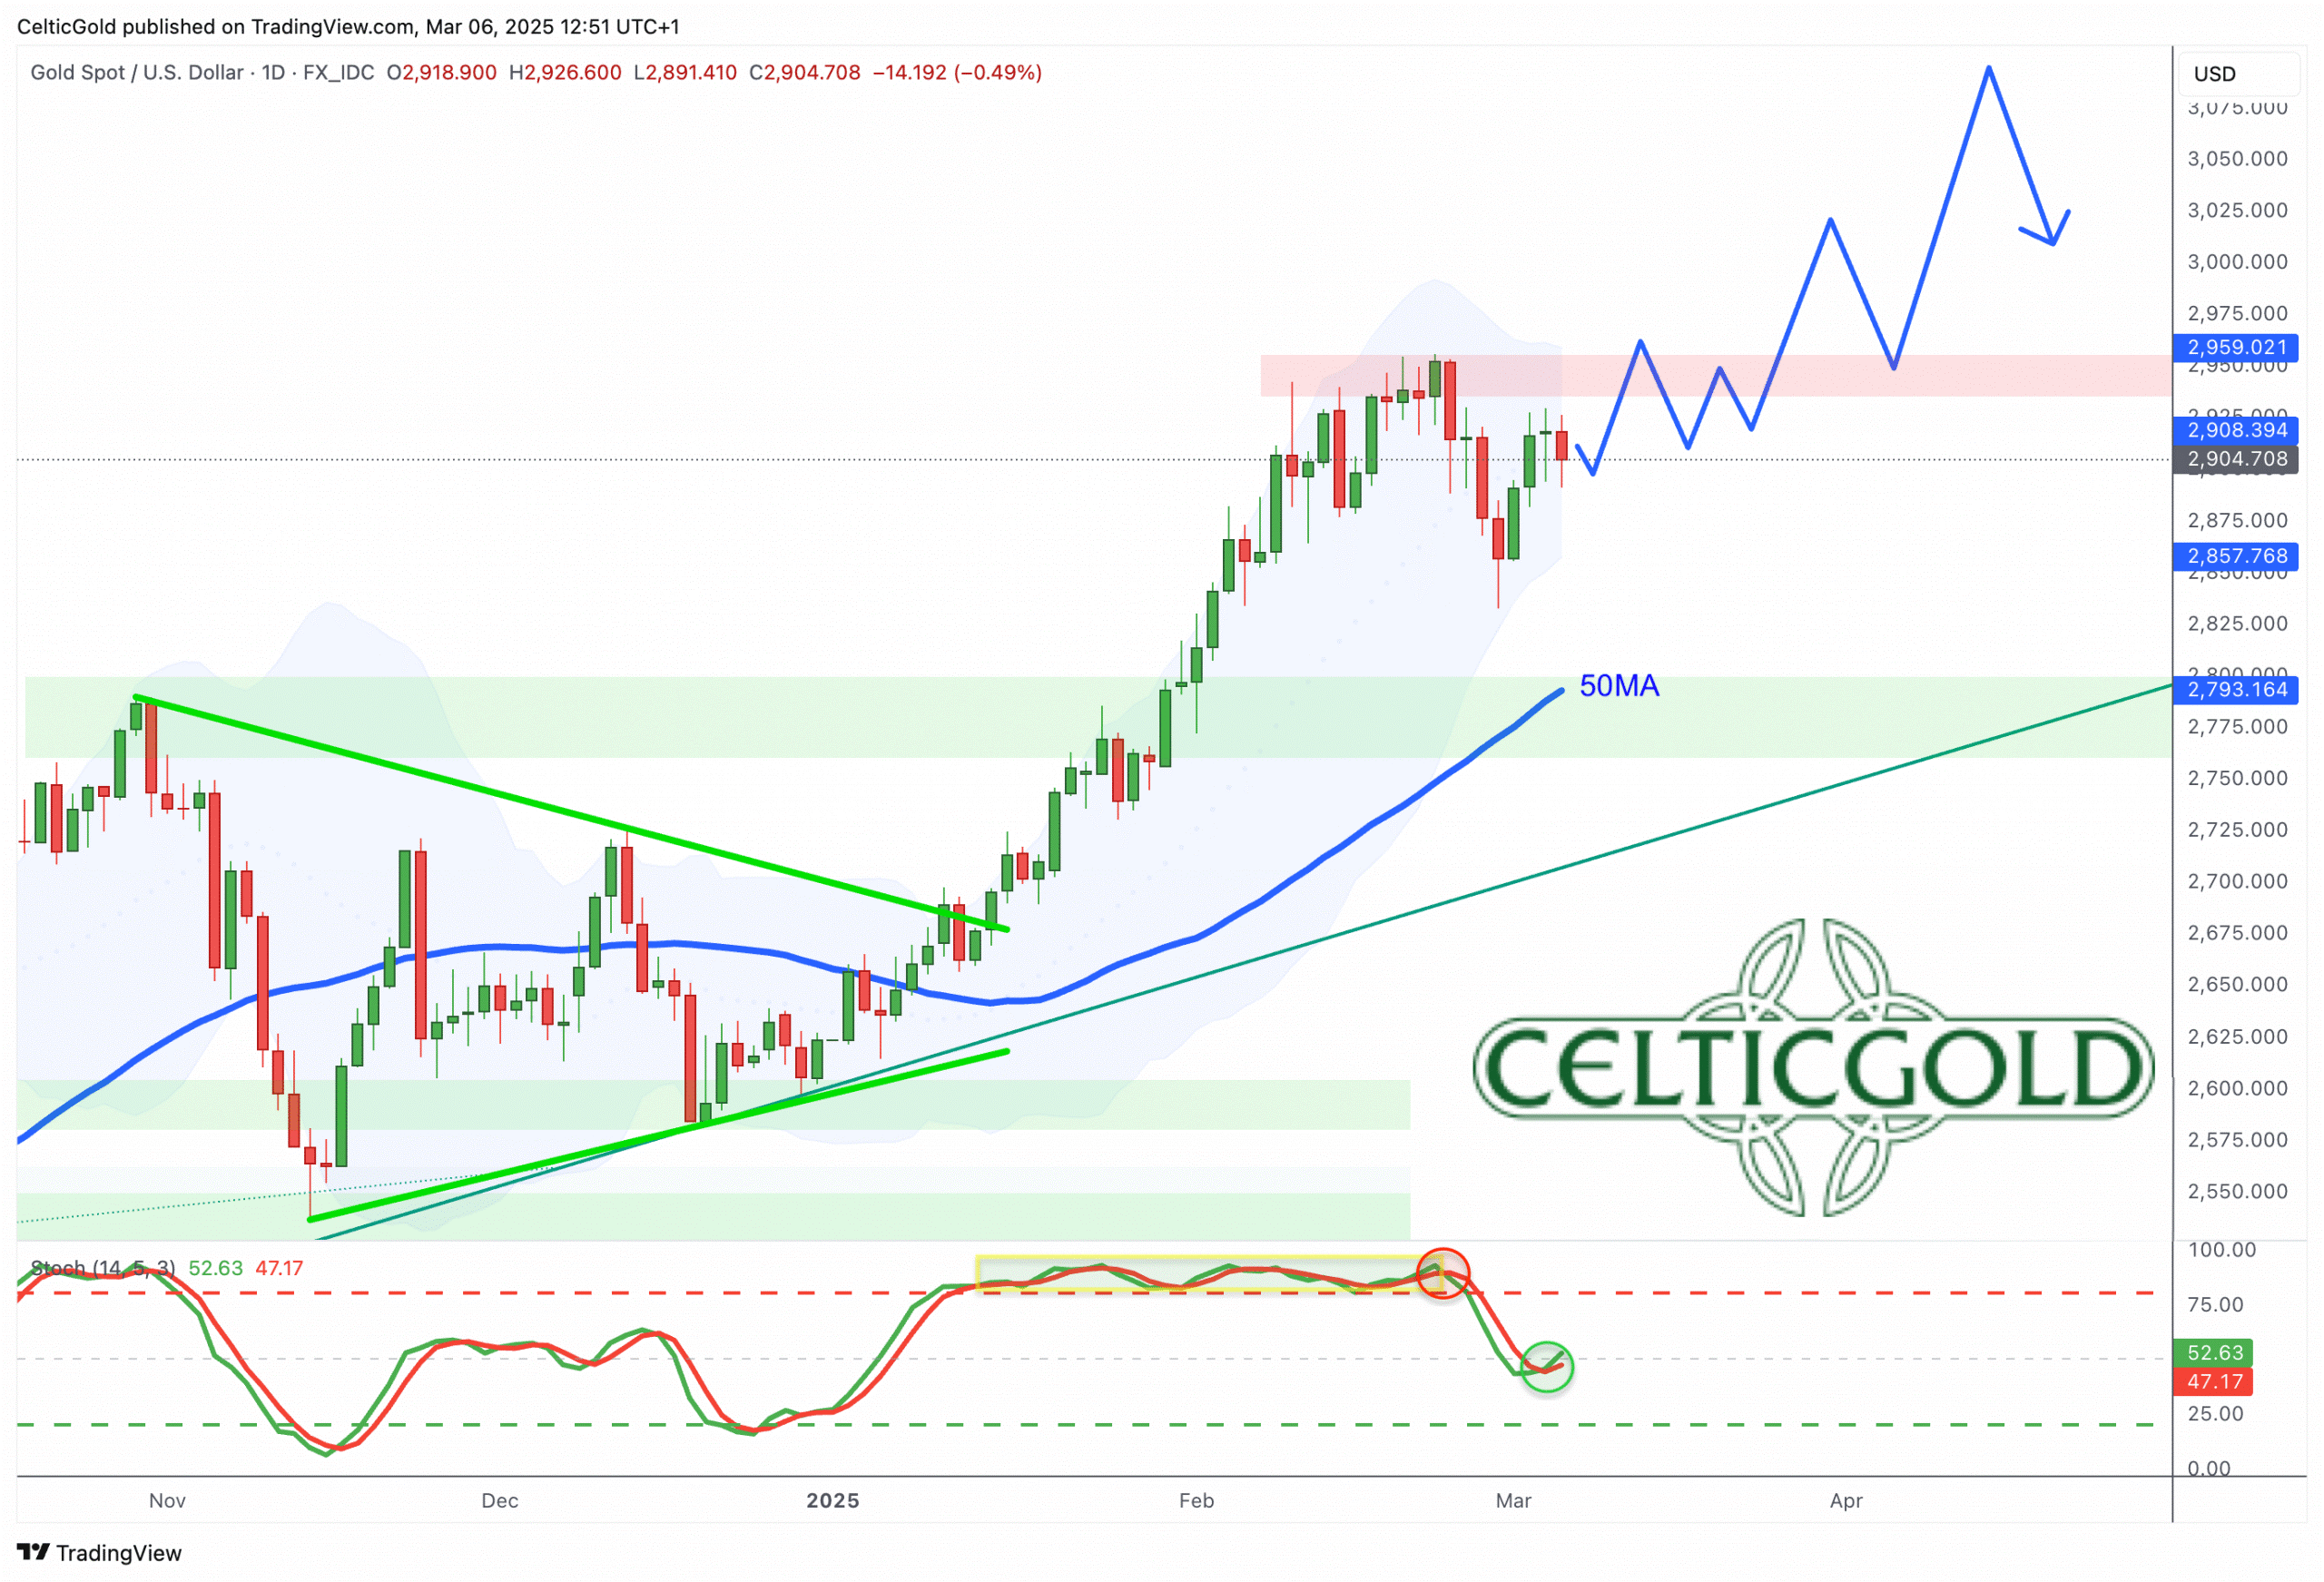
Gold in US-Dollar, daily chart as of March 6th, 2025. Source: Tradingview
After the recent rally of over USD 350, which left the gold market extremely overbought, gold desperately needed to take a breather. The sharp pullback to USD 2,832 in the previous week quickly generated panic among investors and trend followers. While most market participants had been chasing the gold price for weeks, no one dared to buy the deep dip at the beginning of this week.
February futures expiration triggers market manipulation”
It’s important to note that the February gold futures contract expired at the end of the month on last Friday. This created increased hectic activity, as professional traders had to either deliver or roll over their contracts. All major professional market participants attempted to move prices in the direction most favorable to them. This involved not only rolling over contracts but also cash settlements and the expiration of options. When large banks, often net short, push the price down, they pay less for options and cash settlements, while long positions incur losses. A price decline below certain thresholds can cause call options above that strike price to become worthless. Similar to the “Triple Witching Days” in stock markets, there’s a “sweet spot” where the net value of all put and call positions is most favorable for the banks.
Consequently, the sell-off in the past trading week was likely due to an orchestrated suppression action to produce a month-end closing price clearly below USD 2,900 and render all previously sold options from the last three weeks worthless. With the strong recovery at the start of the first week of March, the selling pressure has already disappeared.
Overall, the daily chart is bullish and provides a new buy signal. A sustainable rise above USD 2,930 unlocks an attack on the new all-time high of USD 2,956. Subsequently, gold should be able to surge towards USD 3,000 and beyond. A less likely alternative would be for the current recovery to fail around USD 2,930ish, followed by a search for a second leg above Friday’s low of USD 2,832 which could then lead into another triangle consolidation.
Commitments of Traders for Gold – Bearish
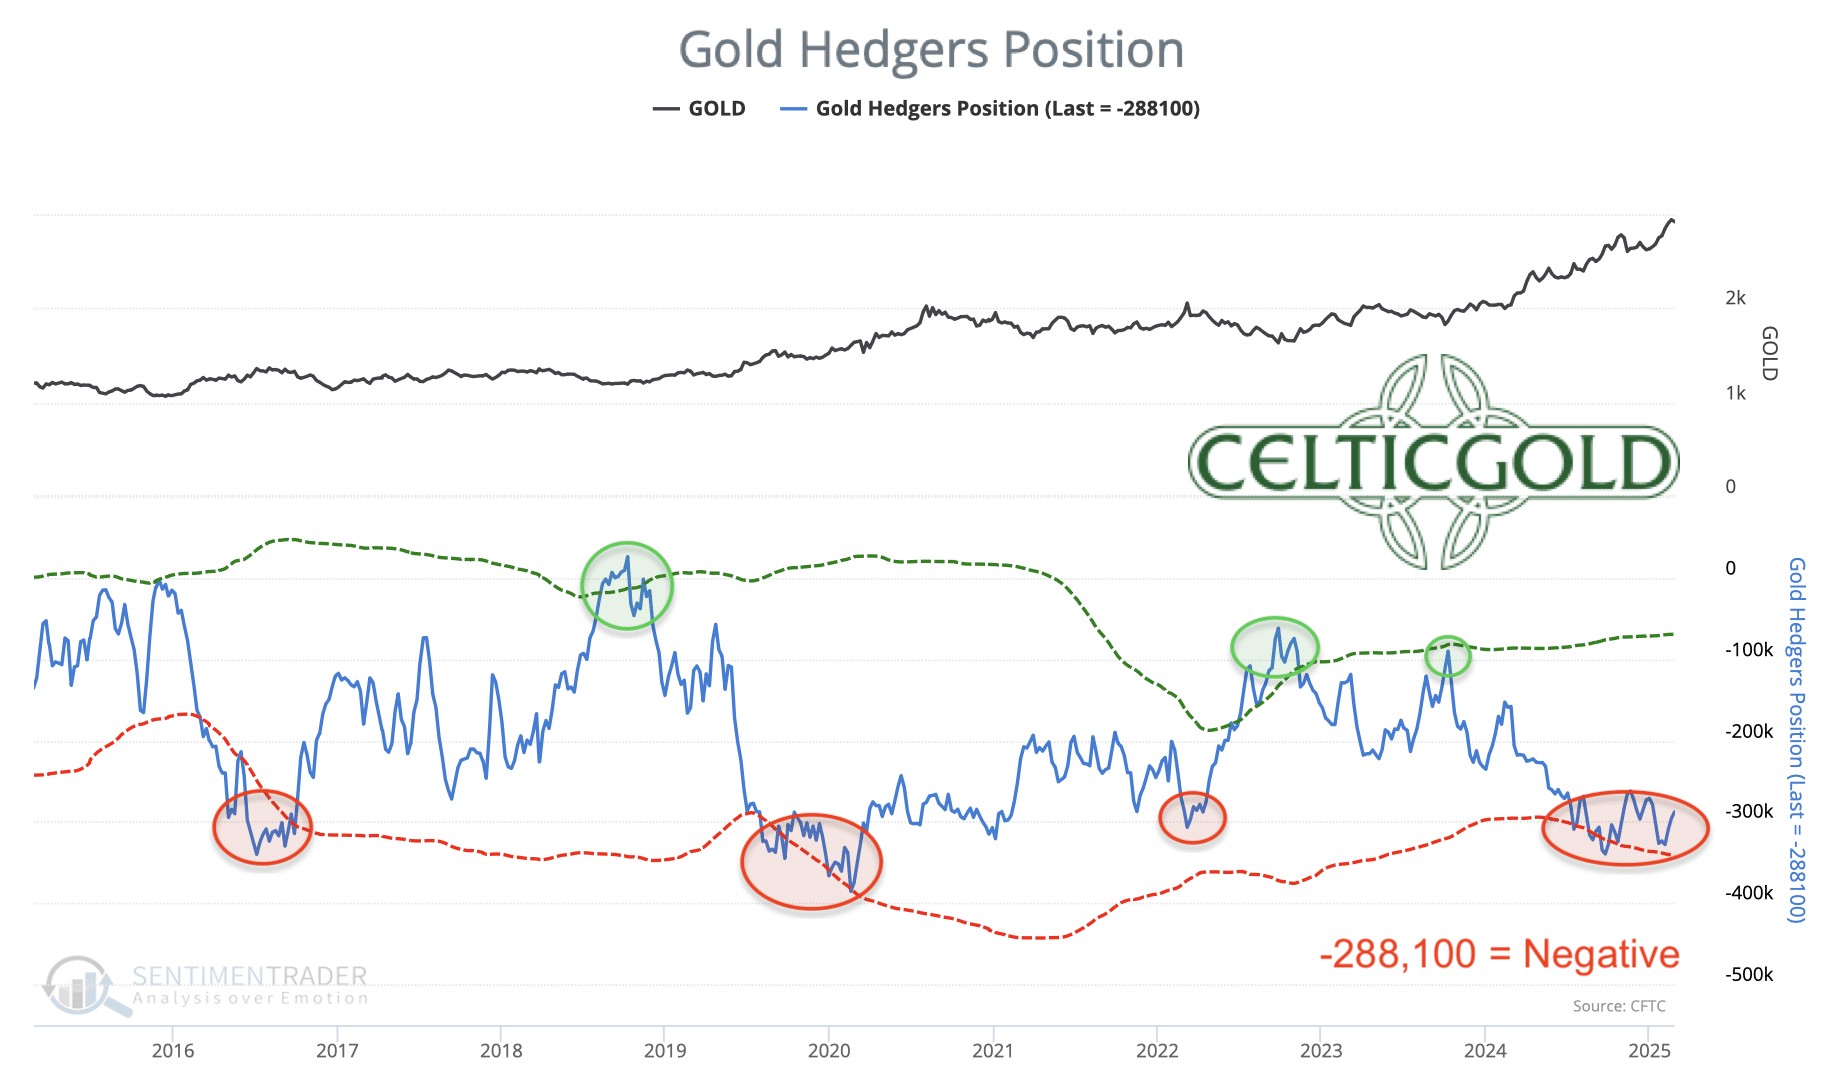
Commitments of Traders (COT) for gold as of February 25th, 2025. Source: Sentimentrader
At the closing price of USD 2,918, commercial traders held a cumulative short position of 288,100 gold futures contracts on Tuesday, February 25th. Given the strong rally of over USD 350 since mid-December, the commercial short position has increased surprisingly little. At the same time, these short positions have further gone underwater, and the professionals may have started to sweat recently. Presumably, numerous contracts were covered during the price slide to USD 2,832 on Thursday and Friday.
Based on the last 20 years, the CoT report remains very negative and clearly bearish. Significantly lower gold prices would be needed before this analytical component could be interpreted as neutral or even contrarian bullish. Simultaneously, the informative value of the CoT report seems very limited given the problems in the physical gold market in.
Sentiment for Gold – Cold shower was necessary
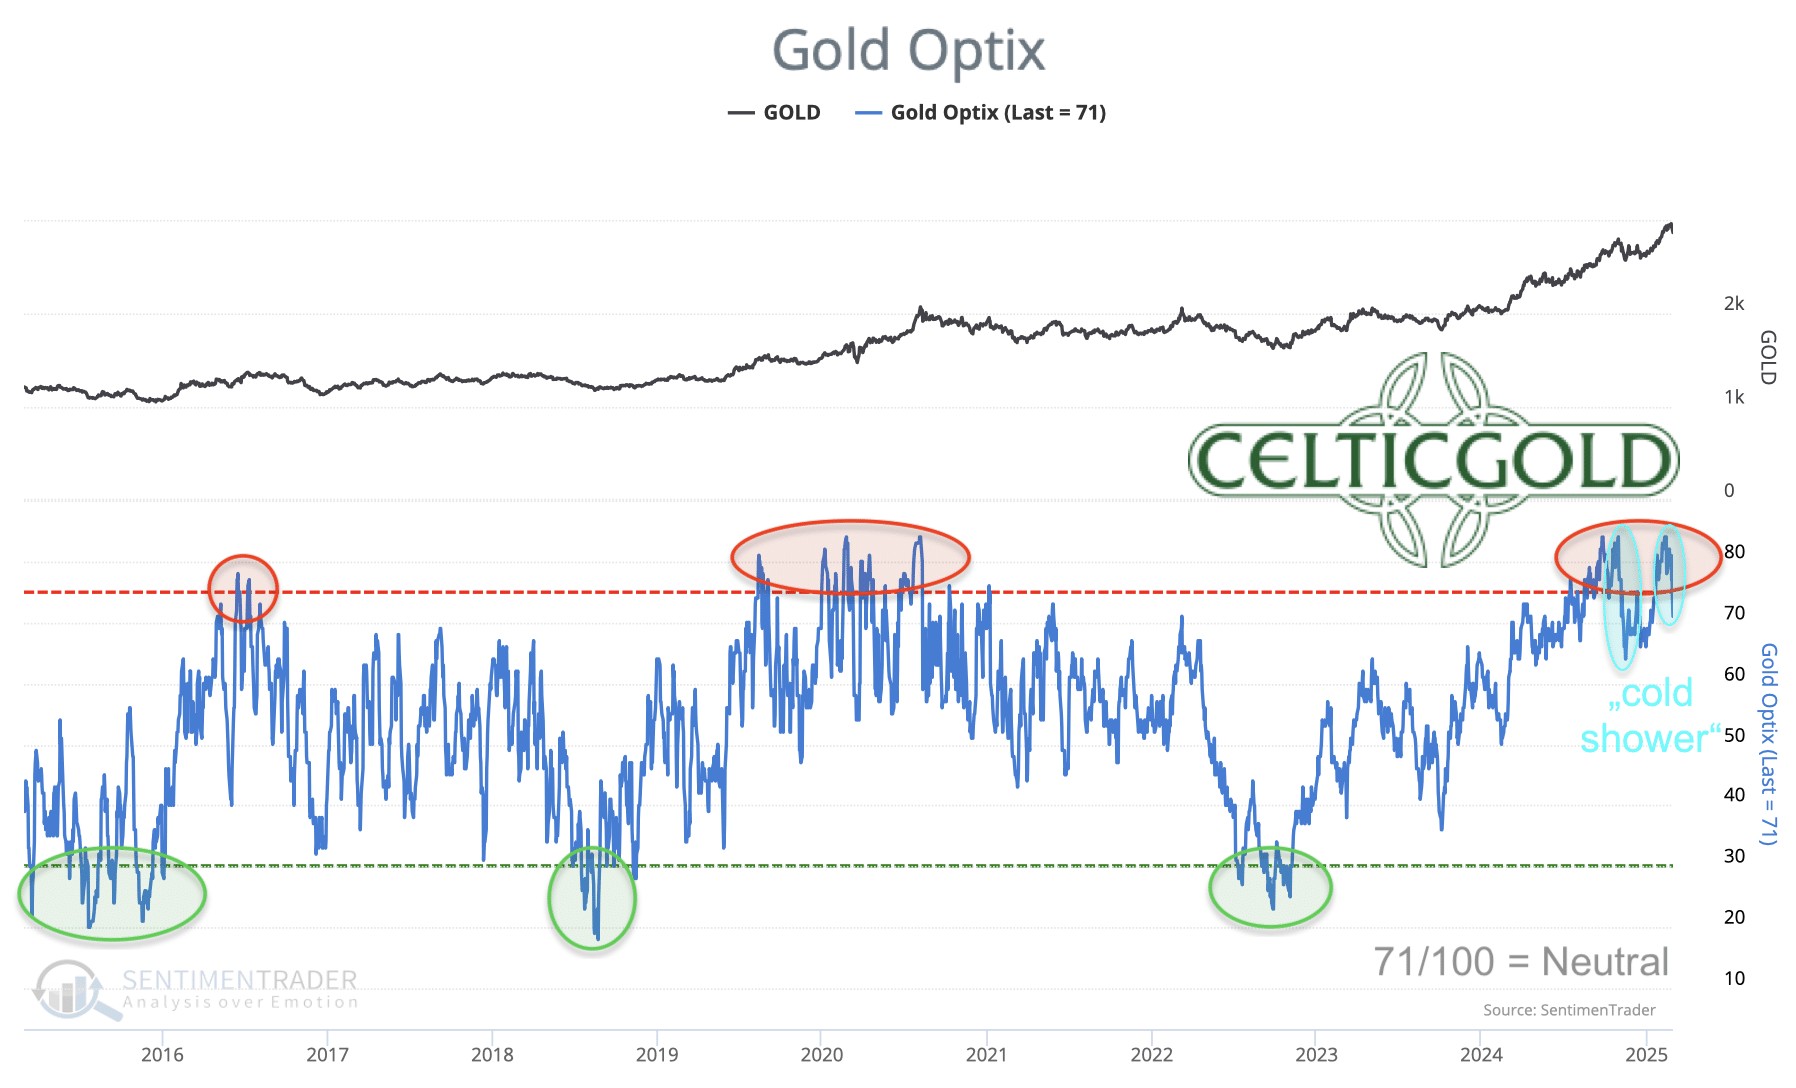
Sentiment Optix for gold as of March 5th, 2025. Source: Sentimentrader
After the healthy cool-down in November and December, sentiment in the gold market quickly became euphoric again since the beginning of the year. However, thanks to the sharp pullback from USD 2,956 to USD 2,832, a considerable amount of hot air has already escaped. Currently, the Sentiment Optix for gold stands at 71 out of 100 points, just below the euphoria zone.
In the past, an excessively optimistic sentiment could persist for months, with occasional “cold showers” like the one last week necessary to temper market participant’s greed. As such, sentiment is no longer standing in the way of a continuation of the rally at present.
The Sentiment Optix reading suggests that while optimism remains high, it has retreated from extreme levels, potentially creating a more balanced market environment. This moderation in sentiment could provide a healthier foundation for the next price appreciation.
Seasonality for Gold – Strongly bullish until mid of May
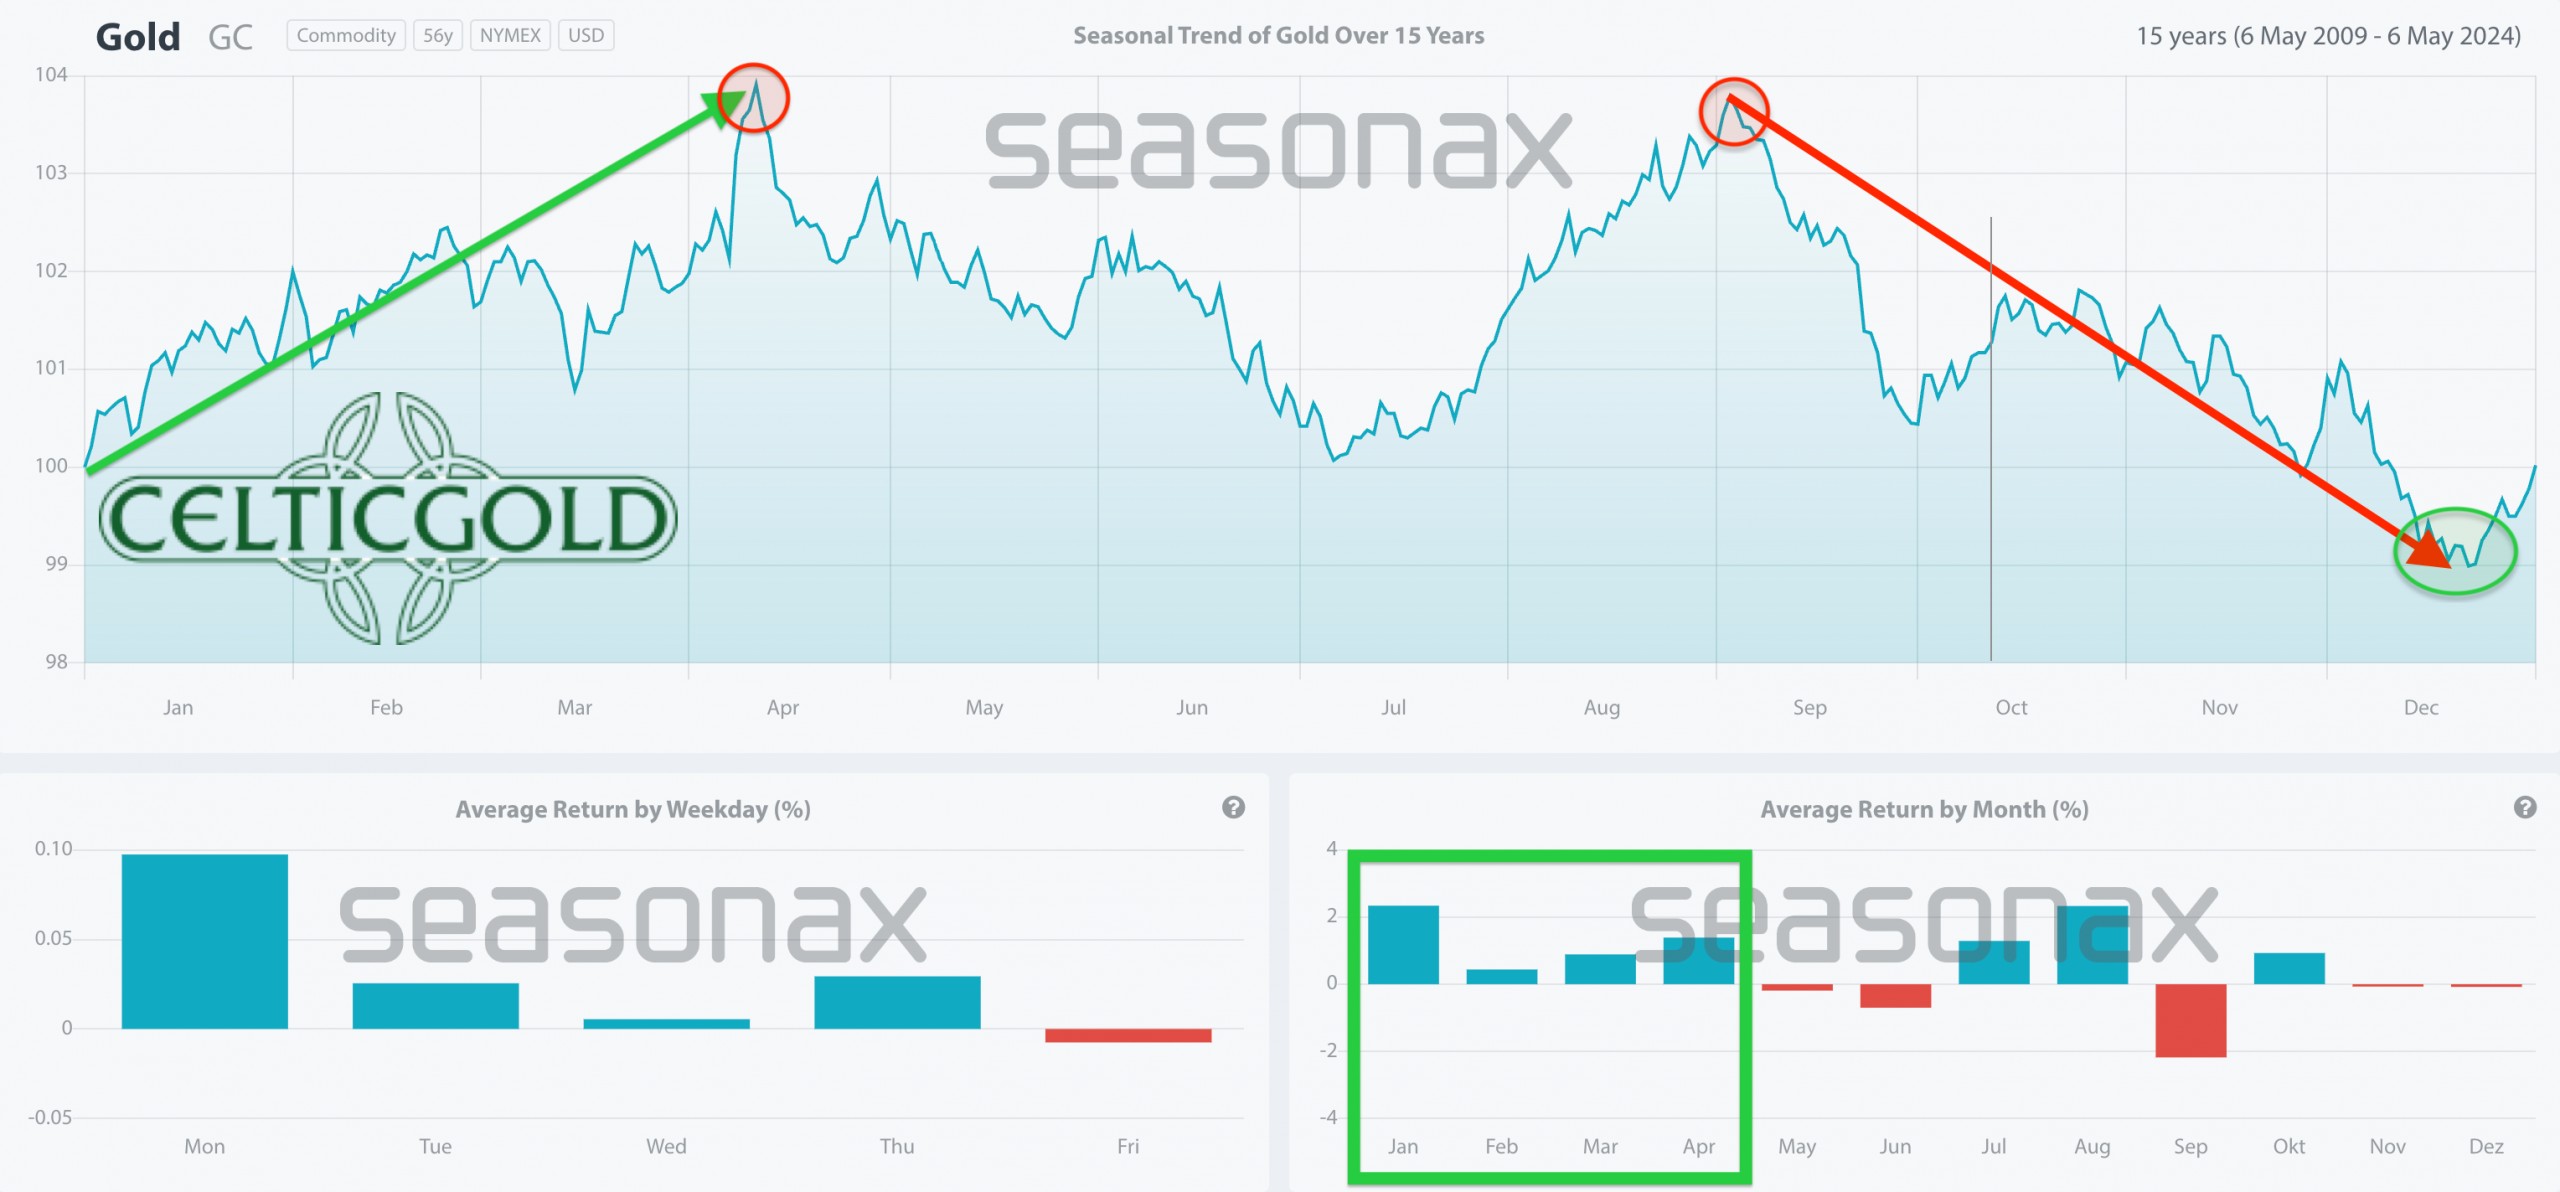
Seasonality for gold over the last 15-years as of May 6th, 2024. Source: Seasonax
Without a doubt, the gold price is in its best phase of the year. In the past, this phase, starting from mid-December or the beginning of the year, almost always led to significant increases lasting into spring, sometimes even extending into early summer.
Accordingly, the rally should have at least a few more weeks to run. The peak could be seen between mid-March and mid-May. Particularly if silver also experiences a steep rise for a few weeks, we would have, in addition to seasonality, another strong indicator for an approaching top in precious metal prices.
Overall, seasonality is strongly bullish and should drive precious metal prices to new highs in the coming one to three months.
Macro update – Wild rollercoaster ride at turbo casino 2025
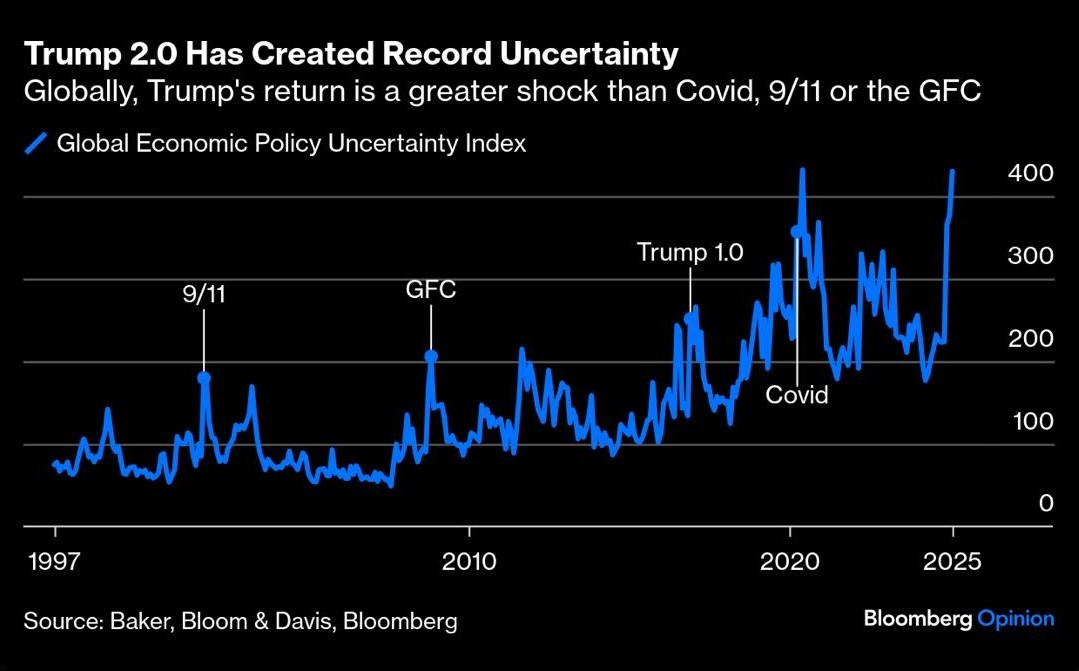
Trump 2.0 has created record uncertainty. Source: Baker, Bloom & Davis, Bloomberg
Uncertainty is an inherent part of change, and those who fear it are destined to fail! Although we may experience an extremely wild rollercoaster ride in the coming months as the new US administration attempts to implement many positive, radical, and revolutionary changes, the medium-term outlook for real assets and wealth remains highly bullish.
The Unwinding of the “Trump Trade”
While 2024 proved to be exceptionally positive for most market sectors, the first two months of 2025 paint a different picture. The “Trump Trade,” which primarily boosted digital assets at the end of 2024, has undergone a correction. Within just six weeks of taking office, US President Donald Trump has created record levels of uncertainty through a series of sweeping changes and controversial policies.
Trump signed approximately 70 executive orders and directives within his first month in office, far more than any previous president in a comparable timeframe. Many of these orders are being challenged in court, further exacerbating legal and political uncertainty. While these rapid and often contentious measures have created an atmosphere of unpredictability in domestic and foreign affairs, his economic decisions—such as mass layoffs in federal agencies, efforts to cut spending, and reduce bureaucracy—are generally pro-business. However, their effects will only become apparent in the coming months.
Unsurprisingly, markets have become much more volatile as they grapple with this unfamiliar and unpredictable new style of US politics. Wild fluctuations can be observed across many sectors. For example, Bitcoin plummeted from USD 110,000 to USD 78,600 (-28%) since January 20th but then surged back to USD 95,000 (+21%) last Sunday after Trump announced plans for a US Bitcoin reserve. However, much of this gain was erased at the start of the week. This extreme volatility is fueling uncertainty and increasing unease among market participants.
Gold takes the lead
Meanwhile, gold has experienced an unprecedented rally, reaching a new all-time high of USD 2,956 on Monday, February 24th. However, volatility has also exploded in the gold market. We believe this volatility is necessary to propel gold prices above USD 3,000.
The music is still playing
On a broader scale, the crack-up boom persists, with Germany becoming the latest country to join the international race to the bottom. The incoming German government has unveiled a historic “Whatever It Takes” fiscal package, triggering significant market reactions.
This unprecedented fiscal shift has send swap spreads crashing ahead of the debt avalanche and includes plans to reform the debt brake, create a EUR 500 Bio special investment fund, and loosen fiscal rules for defense spending. The proposal aims to boost Germany’s sluggish economy and modernize its infrastructures.
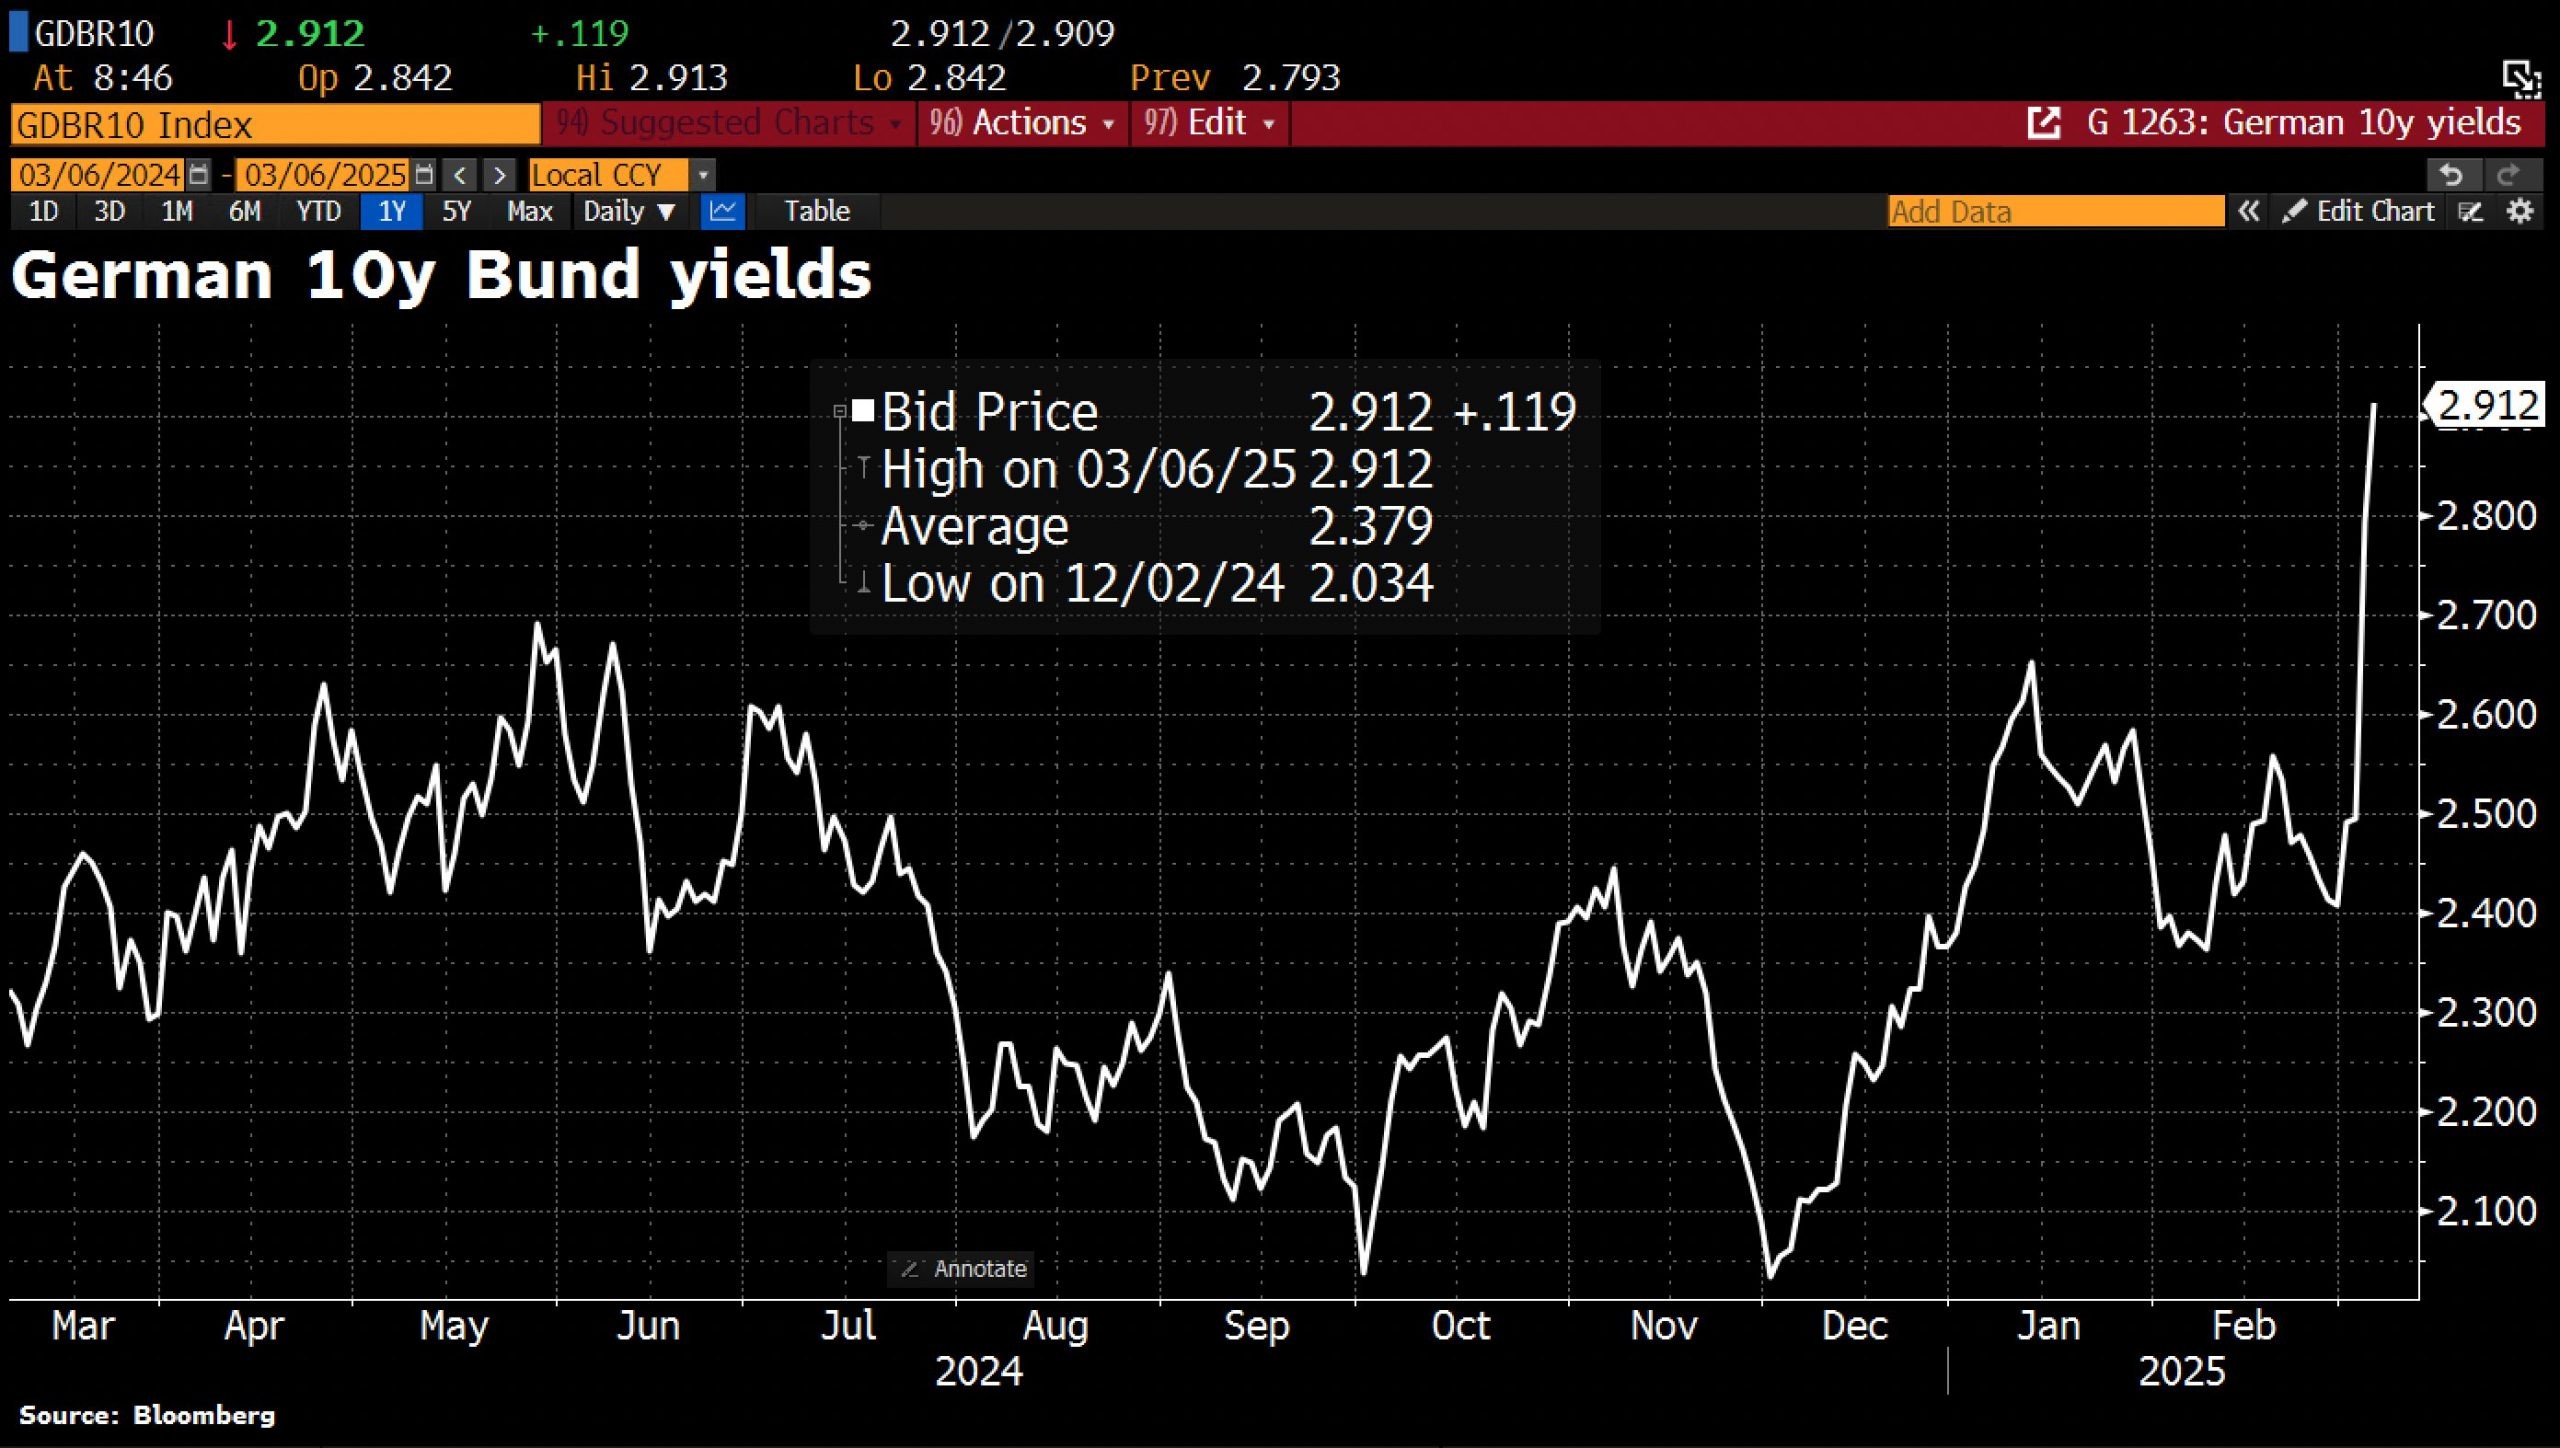
German 10-year bund yields, as of March 6th, 2025. Source: Holger Zschaepitz
In response, German bond markets experienced a dramatic sell-off, with 10-year Bund yields surging by over 24 basis points, marking the largest yield jump in German bond market history. Simultaneously, German swap spreads crashed to record lows as the market grappled with the implications of this massive fiscal expansion.
The scale of potential spending is staggering, with estimates suggesting up to EUR 1 trillion in large-scale investment programs over the coming years. This fiscal U-turn represents a significant departure from Germany’s traditional fiscal conservatism and could be a game-changer for the country’s economic trajectory. At the same time this is highly inflationary, of course.
Conclusion: Gold – Healthy Pullback Already Over
The gold market has resumed its upward trend after a healthy correction phase in November and December. Since the beginning of the year, gold bulls have driven the price upwards at an impressive pace.
This dynamic upward movement has been supported by a spectacular combination of factors, most notably the significant shift of gold holdings from London to New York. This has led to a shortage of physically available gold in London and, for the first time in decades, has generated genuine mistrust towards unallocated gold investments. As a result, the psychology of investors has changed dramatically. Now, large investors want and need to ensure that their gold holdings actually exist physically!
Outlook positive until late spring
The sharp pullback from USD 2,956 to USD 2,832 seems to have already been overcome, given the V-shaped recovery. Indeed, gold bulls are coming back into the market forcefully in the first week of March, once again demonstrating the impressive resilience of recent weeks. While a second corrective leg cannot be entirely ruled out in the short term, the overall picture remains extremely bullish. Seasonality suggests a possible peak between mid-March and mid-May.
Next price targets above USD 3,000, while silver is setting up for a spike
Overall, the market development remains strongly bullish, and we expect market participants to want to see the round psychological mark of USD 3,000 as soon as possible. The next price target is around USD 3,020. Beyond that, the target from the large cup-and-handle formation of the last 14 years awaits at around USD 3,080! On the way there, sharp pullbacks of up to USD 150 can occur at any time! In general, volatility in the gold market will continue to increase.
Furthermore, we suspect that silver will embark on a spectacular catch-up rally in the coming weeks. Price targets above USD 40 and perhaps even around the all-time high of USD 50 are conceivable.
“March 6th, 2025, Gold – Healthy Pullback Already Over” – analysis was initially published on March 4th, 2025, by www.celticgold.de and translated into English on March 6th, 2025.
Feel free to join us in our free Telegram channel for daily real time data and a great community. If you like to get regular updates on our gold model, precious metals and cryptocurrencies you can subscribe to our free newsletter.
*********
 Florian Grummes (born 1975 in Munich) has been studying and trading the Gold market since 2003. In 2008 he started publishing a bi-weekly extensive gold analysis containing technical chart analysis as well as fundamental and sentiment analysis. Parallel to his trading business he is also a very creative & successful composer, songwriter and music producer. You can reach Florian at: [email protected].


