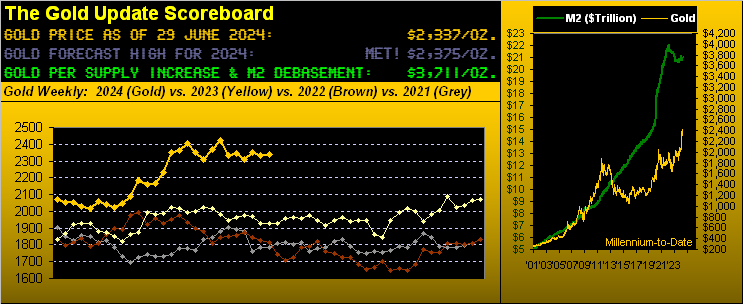
Gold Looks to Support as Our Key Trend Goes Short


“And so we are halfway.” In this case ’tis not Fräulein Irma Bunt to James Bond (in the guise of Sir Hilary Bray) whilst walking upon the snowy flanks of Switzerland’s Schilthorn –[O.H.M.S.S, UA, ’69], but rather for our purposes the mid-point of 2024’s trading year. (Yes, we are aware that the precise mid-point is not until this Tuesday’s settle when with 126 trading days in the books there’ll remain 126 in the balance). Nonetheless, ’tis the end of June and thus time for our monthly view of it all.
And bang on time in stride with our negative near-term bent for Gold — whilst settling yesterday (Friday) at 2337 for a whopping weekly gain of +2 points — on Wednesday, Gold’s anticipated damage was done as price broke below 2320 such as to flip our key 16-week parabolic Long trend now to Short. (Expected as ’twas, ’twasn’t a beautiful thAng, even as we then “X’d” [@deMeadvillePro] notice of said flip). Regardless, as scored by Chicago back in ’69:  ““Where do we go from here?” ”
‘Course, you regular readers already know the answer to our musical query. For waiting in the wings as herein depicted via recent missives is Gold’s 2247-2171 structural support zone. Below ’tis with the weekly bars from a year ago-to-date. And encircled therein is the rightmost red dot heralding the start of the new parabolic Short trend:
Still, as we oft and rightly quip, “Shorting Gold is a bad idea” given opening up-gaps et alia can cancel one’s trading account. Moreover as our friend in the above graphic muses, the prior two parabolic Short trends have lasted but three weeks each.
Yet with a proper eye toward cash management, similar to Gold’s negative weekly MACD crossover as confirmed two weeks ago, in now reviewing the past dozen weekly parabolic Short trends (which date back to 04 March 2019), the average downside price adversity is -90 points (the median being -71 points). So as was demonstrated for the current MACD case, an “in that average vacuum” move from here at 2337 similarly would place Gold smack on the upper boundary of the 2247-2171 zone. No, you cannot make this stuff up.
“But mmb, with the economy tanking and inflation kinda gone, price should skyrocket, right?“
Which, Squire, presumes our recent notion that the Federal Reserve must cut rates commencing 30 July, (albeit SanFranFedPrez Mary “Don’t!” Daly inferred this past Monday that it may still be too soon to move). But rate reductions do elicit more lending, the Fed-sourced proceeds of which resume debasement of the money supply, in turn adding to Gold’s valuation (presently by the opening Scoreboard’s 3711 vs. the current price of only 2337). ‘Course until such rate cut actually happens, Gold’s negative technicals can well will out as typically they do (which is why we do the math toward reasonably guesstimating how low is low). Still either way, as liquid markets go, nobody really knows.
However what we do know is that inflation has started to slow. Having yesterday received the “Fed-favoured” Bureau of Economic Analysis’ Personal Consumption Expenditures Price Index for May, we can complete that month’s inflation table which also incorporates the Bureau of Labor Statistics’ reads for both its Consumer and Producer Price Indices. And here’s what we see:
The right-hand column is key as ’tis the annualization of May’s inflation pace for all six measures. In other words for you WestPalmBeachers down there, this is the “What’s happenin’ now” way of looking at it. And the average rate of annualized inflation solely per May’s paces is only +0.2% as shown. Yes, the left-hand column’s 12-month inflation summations are all above the Fed’s precious +2.0% target; but given the (arguably magical) disappearance of inflation in May, clearly the trend must be down, right? (Please no email about “But mmb, we just went to the store and, and, and…” Believe us, we truly understand). We’re merely capsulizing that disseminated by the stated StateSide government bureaus.
Now in Squire’s having initially mentioned inflation, so too did his question include the “tanking” of the economy. So severe has been the Economic Barometer’s plunge — notably through this year’s second quarter — ‘twould not surprise us one wit that come 25 July the first read of Q2 annualized Gross Domestic Product shall be negative. Just a thought, but don’t forget ’twas barely positive for Q1 at +1.4%, the lowest GDP reading since climbing out of COVID during the Spring of 2022. Here’s the year-over-year graphic, the so-to-speak “earningsless” S&P 500 well up in the sillysphere:
Specific to the Econ Baro, ’twasn’t all bleak last week. The Chicago Purchasing Managers’ Index for June — whilst still in net contraction for 21 of the past 22 months — nonetheless improved to 47.4, its best reading since that for November of last year; (yet a reading below 50 still signifies manufacturing contraction). Too, Personal Income for May increased +0.5%, tying it for the second-best increase across the past 12 months. But is that inflationary, (nudge-nudge, hint-hint, wink-wink, elbow-elbow…)
Hardly inflationary has been Silver’s rise to the top of our BEGOS Market Standings year-to-date. Best of the bunch as she is, Sister Silver remains cheap! The Gold/Silver ratio is now 79.4x: but the century-to-date average is 68.3x; were Silver thus priced by that yardstick today (just in case you’re scoring at home), rather than being now at 29.44, she’d be +16% higher at 34.22.
Then in second spot lies (appropriate verb there) the S&P 500, its being purely herd driven on Investing Age of Stoopid delusion. Cue that recorded in 1929 by Memphis Minnie and Kansas Joe McCoy: ““When the Levee Breaks” ” Remember what also happened that year? When the “Look Ma! No Money!” crash hits, ’twill be pure herd fear, whilst Silver and Gold are held dear:
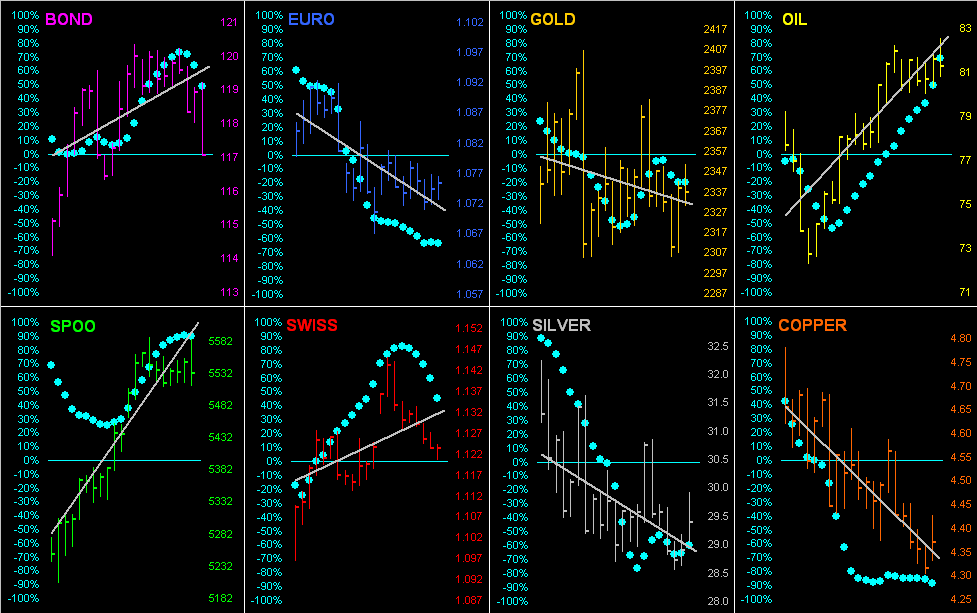
Now it being month-end, let’s go ’round the horn for all eight BEGOS Markets by their bars across the past 21 trading days and “Baby Blues”, the dots that depict the day-to-day consistency of each component’s respective grey trendline. If it all appears a fundamentally misvalued mess, you are correct. But: the markets [truly] are never wrong, (even as the S&P today trades at nearly double its earnings support and Gold at arguably half its currency debasement value). Sleeping well, are you? The S&P 500 market capitalization is now $47.7T buttressed by a liquid US money supply of only $21.0T. (Did we mention the “Look Ma! No Money!” crash?) Got Gold?
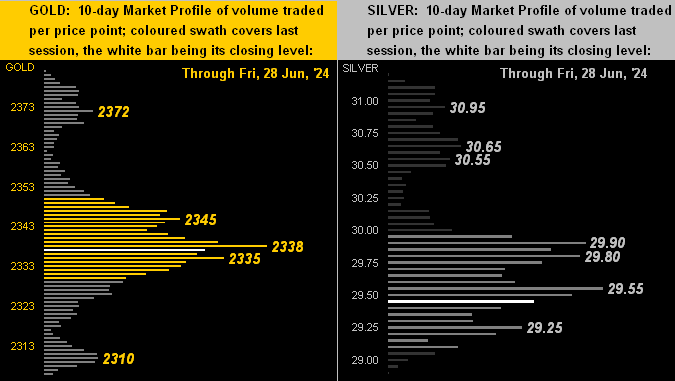
Similar to this time a week ago, we again find Gold on the left and Silver on the right both presently priced a bit below the mid-point of their 10-day Market Profiles. For Gold, 2338 clearly is the near-term support/resistance price, whereas same for Silver is pretty much a hodge-podge of the 29s:
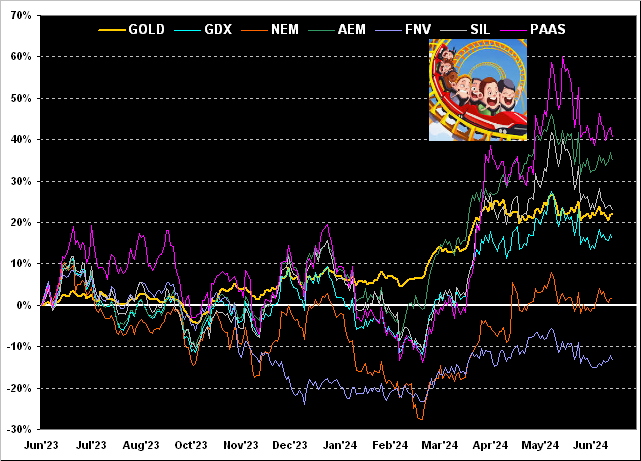
And with June now in the books, ’tis time to assess Gold’s year-over-year percentage growth relative to that of its equities brethren. So from high-to-low we go with Pan American Silver (PAAS) +40%, Agnico Eagle Mines (AEM) +35%, the Global X Silver Miners exchange-traded fund (SIL) +23%, Gold itself +22%, the VanEck Vectors Gold Miners exchange-traded fund (GDX) +16%, Newmont (NEM) +2%, but Franco-Nevada (FNV) -13%. If you love rollercoasters, the metals’ equity leverage is for you!
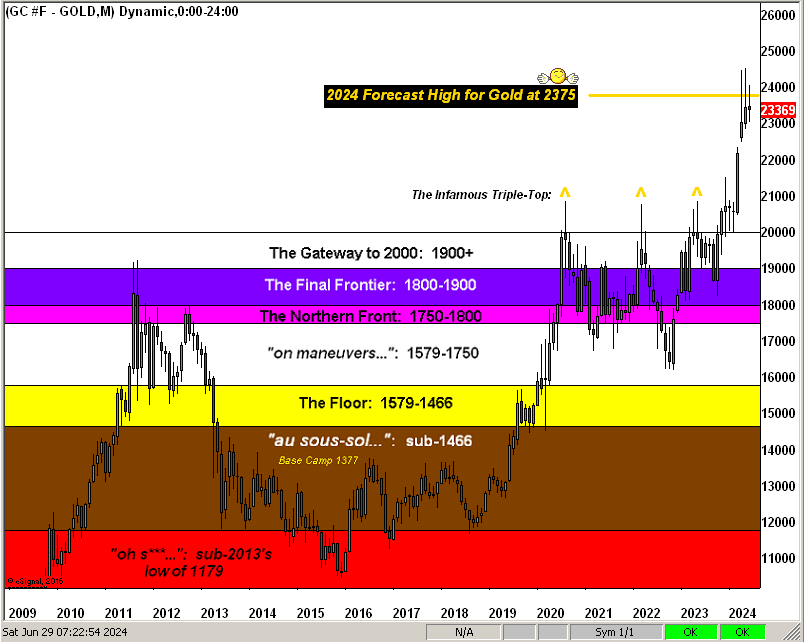
Also as we tend to quip at month-end, ‘twouldn’t be so without Gold’s layered chart for the past 16 years by the monthly candles. Whilst we hope we’re well wrong about this year’s forecast high (2375), so far ’tis relatively holding there in the sky:
Thus with half the year gone, in the proverbial nutshell: Gold broadly looks great to go, but near-term technicals initially say no. Either way, we’ll see what shows. Indeed, how much Gold have you got stowed?
Cheers!
…m…
www.TheGoldUpdate.com
www.deMeadville.com
and now on “X”: @deMeadvillePro
********

Mark Mead Baillie has had an extensive business career beginning in banking and financial services for two years with Banque Nationale de Paris to corporate research for three years at Barclays Bank and then for six years as an analyst and corporate lender with Société Générale.
For the last 22 years he has expanded his financial expertise by creating his own financial services company, de Meadville International, which comprehensively follows his BEGOS complex of markets (Bond/Euro/Gold/Oil/S&P) and the trading of the futures therein. He is recognized within the financial community of demonstrating creative technical skills that surpass industry standards toward making highly informed market assessments and his work is featured in Merrill Lynch Wealth Management client presentations. He has adapted such skills into becoming the popular author each week of the prolific “The Gold Update” and is known in the financial website community as “mmb” and “deMeadville”.
Mr. Baillie holds a BS in Business from the University of Southern California and an MBA in Finance from Golden Gate University.


