Gold Market Update
Last week saw a severe breakdown in the Precious Metals sector that is now viewed as marking the start of a bearmarket, and that means the onset of a deflationary episode that is likely to prove more serious than that we witnessed in 2008, because it will involve countries going bust rather than "just" banks and large corporations as was the case in 2008.
At first glance gold's 3-year chart still doesn't look too bad, with its price in the vicinity of a still rising 200-day moving average, but last week it broke below this average for the first time since 2008, which is in itself a serious warning, and ominous devolopments on the charts for silver and the Precious Metals stocks indices, strongly suggest that gold is in the process of completing an important top area, which looks like it is taking the form of a bearish Descending Triangle. Momentum as shown by the MACD indicator, is now firmly in negative territory, and failure of the important support level at the lower boundary of the suspected Descending Triangle will lead to a severe decline as shown.

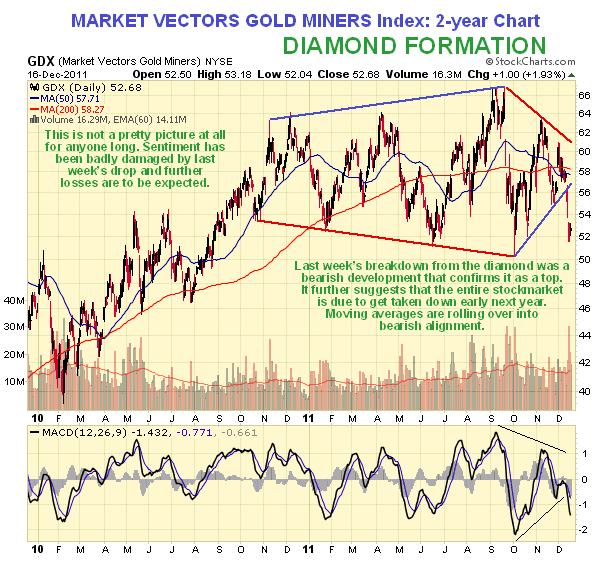
The Market Vectors Gold Miners Index (GDX) broke down last week from the Diamond formation that we had identified a week or two ago, confirming that the pattern that has developed this year is a large top area. This being so it is clear that both gold and silver are in the late stages of large top areas from which they are both soon likely to break down, and also that a major deflationary episode is in the works that will see the still elevated broad stockmarket suffer a severe decline, probably similar to that which occurred in 2008. The breakdown in the GDX was a very serious bearish development, so any rallies arising from the current oversold condition are likely to meet heavy selling and are thus unlikely to get far. Whatever rallies now occur should be aggressively sold - the real downside fireworks are likely to occur in the New Year.

On the 5-month chart for the GDX index we can clearly see the fine example of a rare "Fish Head" Triangle, which is what enabled us tocall an imminent big move in the sector last weekend, although at the time we did not know which way it would break . To enable those readers less endowed with imagination to spot the Fish Head pattern, an eye and mouth have been added to the chart. We placed a general stop beneath this Triangle which took us out of most positions, and a straddle was recommended for speculators which has already garnered big profits.

At the same time that the PM sector started breaking down last week, the dollar broke out above an important resistance level, negating a potential Double Top, as we can see on its 6-month chart below, although the breakout is not as yet by a decisive margin. This has opened up the possibility of another strong upleg by the dollar, which is of course what we would expect to see if deflation strikes.

How far could the dollar rally? The 5-year chart gives us a good idea - it could run swiftly to the 88 - 89 area during a major deflationary episode.

A big dollar rally of course implies further euro weakness. As we can see on the 5-year chart for the euro, it has just broken down from a Head-and-Shoulders top and could drop back swifly to the vicinity of its 2010 lows in the 120 area or even lower. This implies further turmoil in Europe early next year, which is hardly surprising given the disorderly crew who are running Europe. Actually, it is surprising that the euro is not a lot lower considering what has gone down in Europe in the recent past - it would appear that the markets have been hanging in and hoping for a solution - tough luck if one isn't forthcoming.

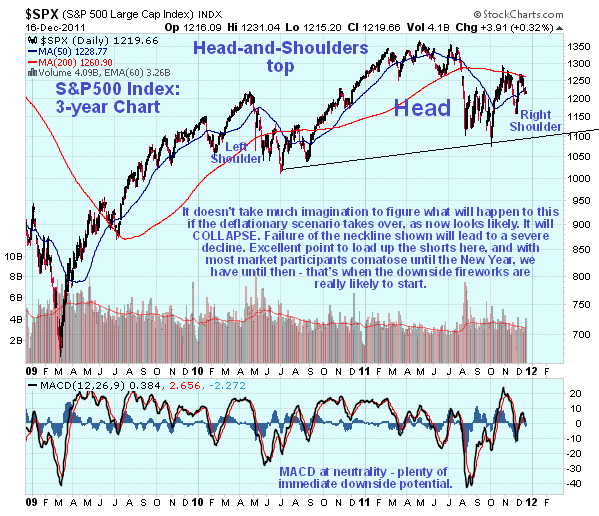
If the PM sector is signaling a major deflationary episide, then we should see signs of topping action in the broad stockmarket, and we do. A large Head-and-Shoulders top is completing in the S&P500 index, and with the index high in the Right Shoulder we are believed to be at an excellent point go short, buy bear ETFs etc, which we will be reviewing on the site shortly. One leading market commentator who actually has a very good track record recently said that the markets will continue higher "because people are going to continue getting up in the morning and going out to work in order to buy stuff for themselves and their families". Oh, is that right? - try telling that to the 50% of Spanish youth who are out of work and can't find it no matter how hard they try BECAUSE THE JOBS DON'T EXIST due to the economy of Spain being ravaged by deflation, aggravated by the bursting of a huge property bubble - and what about American workers in the early 30's? - they didn't go around asking "buddy can you spare a dime?" because they were lazy ****ers - they were likewise the victims of deflation. This same writer portrayed the 2008 market meltdown as a "once in a lifetime event", implying that everything´s OK now and that "the great bull will climb the wall of worry". That might be so if the problems exposed by the 2008 financial crisis had been properly dealt with, but they weren't, they were simply "swept under the rug" - papered over with more of the stuff that created the problems in the first place - debt and derivatives - which means that the forces of deflation have now built up to staggering proportions - the lamed zombie banks, who exist now only to line the pockets of their elite executives and sluice fuinds in the direction of favored politicians, and governments nursing monumental debt overhangs are now powerless in the face of the oncoming deflationary train wreck. The final denouement will be when bond markets crash and interest rates skyrocket - that´s when creditors will finally get the message that they are not going to get a penny back. One big reason for the current procrastination is that big private creditors are scrambling to use the current window of opportunity to offload as much bad paper as possible onto governments and thus the taxpayer before the final collapse.

Let's stand back a moment now to consider the larger implications of all these developments on the charts. The breakdowns now occurring across the PM sector are an indication that the forces of deflation are set to assert themselves and come to the fore. These forces have always been there, lurking in the background since the first major deflationary convulsion back in 2008, and their intent is to cleanse the world economic system of the dross of the gargantuan debt and derivatives overhang that is bringing the world economy to a dead stop. The key point to understand here is that these forces may be kept at bay for a while but they cannot be stopped - and creating even more debt and derivatives in an effort to stave off their impact, which is what central banks and governments have been doing since 2008, simply creates a more disastrous situation later on. Thus the accelerated ramping of the money supply and the maintenance of "zombie banks" and the propping up of bond and stockmarkets is an open invitation to disaster on a massive scale. There is still a widespread assumption that somehow "they" will fix it, they will muddle through by creating money out of nothing, juggling things around and engaging in firefighting where deflation threatens to break out and we will eventually come out of the end of the tunnel. We have even fallen for this ourselves having been fooled temporarily by the COTs and other data which it has to be said may be being tampered with. The problem is that the continued increases in debt and derivatives have created a situation that is dangerously unstable and now increasingly out of control. There is also a widespread assumption that that the entrenched powers that be, Goldman Sachs, the Republican Party etc are unassailable and immortal - that's what the Tsar of Russia and his family thought before they were summarily shot by the Bolsheviks in 1918. Nothing is forever.
2012 is going to suck - it probably won't be as bad as the movie "2012", but it's going to suck. Prepare yourselves as best you can - that's what we are going to do on www.clivemaund.com
Some weeks ago in a Silver Market update we had noted that a large potential Head-and-Shoulders top area was completing in silver, but we got "thrown off the scent" by the positive Accum-Distrib line (now rapidly reversing) and the seemingly strongly bullish COT structure. In the light of the severe bearish breakdown by stocks indices last week this potential H&S top is now viewed as legitimate. Silver held up remarkably well last week considering what happened to gold, which is a straw that silver bulls are now clutching on to as evidence that silver is still in a bullmarket, but the reason that it held up so well is that it is close to a zone of strong support towards the lower boundary of the H&S top area. Once this support fails it's "curtains" for silver which can be expected to plunge into the high teens.
The Head-and-Shoulders top is shown on the 3-year chart for silver shown below. On this chart we can also observe various other bearish factors that are now coming into play. One is that silver has been trading way below its 200-day moving average since the September plunge, and this indicator is now rolling over and about to turn down, which will put the price and its moving averages in nerarish alignment for the first time since 2008. Another important bearish factor is that that the MACD momentum indicator shown at the bottom of the chart is now in an established downtrend, and with it now showing an only moderately oversold reading there is plenty of scope for further heavy losses going forward.

The 6-month chart for silver shows recent action in more detail, in particular last week's breakdown from what we can now see was a Head-and-Shoulders continuation pattern, which interestingly forms the Right Shoulder of the much larger Head-and-Shoulders top shown on the 3-year chart above. Some eagle-eyed subscribers pointed this out to me ahead of the breakdown, but fooled by the COT, I did not take it seriously enough. With regards to the COT, if it is not at historically bullish readings, how can silver drop? The answer to that is simple - the further it drops the more bullish the COTs are likely to become, and there is no law against the Commercials going net long one day - now that would be a sight to see.

Clive Maund, Diploma Technical Analysis
[email protected]
www.clivemaund.com
Copiapo, Chile, 18 December 2011


