Gold Market Update
It is now evident that the gold price has been trapped in a narrowing trading range since its early September pre-plunge peak - a Symmetrical Triangle. This type of Triangle, which indicates a state of collective indecision, can lead to a breakout in either direction, depending on what fundamental developments ensue. The main reason that this large standoff pattern has developed at this juncture, in addition to that of an overbought condition having developed that needed correcting, is that the market has been unable to determine which of the primary economic conditions of deflation or inflation is set to take precedence.
In recent weeks the markets have been breaking out in a cold sweat at the prospect of the deflationary implosion that would surely follow if Europe were to go belly up, but then they suddenly realized last week that the global banking elite are going to attempt to come riding to Europe's rescue, in order to prevent a collapse and protect their vested interests which will include pushing the bill for the mess they have created onto the ordinary citizen, and this realization fuelled a strong recovery rally.
Without veering off into a rant it is safe to say that the hopeless economic mess that we find ourselves in today is the direct result of the ballooning of debt and derivatives over many years by opportunistic and irresponsible banks and other companies in the financial sector, with the support and collusion of cronies in government and throughout the business community, with the result that the debt and derivative mountains have grown to such monstrous proportions that they are bringing the world economy to a dead stop, verging on collapse.
The banks and financial sector companies are on the hook for massive losses and after years of garnering huge profits from deals associated with this debt pyramiding, are now scrambling to push all of their snowballing bad debts onto the ordinary citizen. They have already succeeded in doing this in 2008 - 2009 in the US with their "too big to fail" mantra and to put it crudely, the average US citizen has been well and truly shafted, the way that the average European citizen is looking set to be. The reason that they are now getting serious about rescuing Europe, which is why the market rallied last week, is that if they don't they are going to take a massive hit there, that will spill over into the US, as many big US banks hold a vast quantity of European debt instruments. So the name of the game is to get Mrs Merkel and Germany out of the way and proceed to pump up the European Central Bank with manufactured money so that it is up to the task of doing massive QE to maintain basic liquidity in Europe - and also up to the task of committing to massive bailouts, so that the international banking cartel get off as near to "scot free" as possible, and all the debts are pushed off onto the hapless European middle and lower classes. This is, of course, a super-inflationary solution, which is why we are rambling on about all this. The key point to understand is that because the big banks have far more power over the government and individual politicians than the ordinary citizen has, their will is going to prevail and governments will in the end do their bidding. If this reasoning is correct then we should in due course see a rapid shift in Europe towards a major QE operation that will inject liquidity on a massive scale, support the bond markets and bring down yields, and involve intervention to buy up bad debt to insulate the banks from loss and generally ease the acute state of crisis. All this will of course breed what Germany fears so much - roaring inflation, but it will achive its main objectives from the perspective of the elites, which is to insulate the banks from losses and "kick the can down the road".
The previous paragraph is not some hypothetical rambling designed to pad out this article, it is the explanation for last week's explosive rally across the markets. The markets have suddenly started to grasp the "game plan" and are starting to move to discount the highly inflationary implications of it. Massive money printing in Europe will provide "rocket fuel" for the commodity and stockmarkets, regardless of the underlying state of economies, especially if other economic power blocks such as China and the US see what's going on and decide to follow suit. A key point to note here is that a substantial percentage of the market's possible future gains as a result of the pursuit of such policies will be cancelled out by the rapidly diminishing value of money. Now that we have considered the fundamental backdrop, let's proceed to see what the latest charts have to say.
We will start by looking at the broad market using the 3-month chart for the S&P500 index. On this chart we can see the reamrkably strong rally that occurred last week, with a really big up day on Wednesday. However, by Thursday the bulls were temporarily exhausted and the market stalled out beneath its falling 200-day moving average where a couple of rather bearish candlesticks formed on Thursday and Friday, a "doji", followed by a "shooting star", which together suggest that we are likely to see a minor reaction next week. Seeing the rally coming last weekend we scrambled to ditch our shorts on Monday morning, and although adversely impacted by the start of the rally, we still got out with a good profit. Despite the likelihood of a short-term reaction, the action overall last week is regarded as bullish in purport and further gains are expected in due course.
Although the broad stockmarket stole the limelight last week, so that gold and silver made but modest gains, the factors that are bullish for the stockmarket are also bullish for gold and silver, which is why gold is expected to break out upside from the Symmetrical Triangle shown on our 6-month chart before much longer. However, like the broad market, bearish candlesticks showed up on the charts of both gold and silver on Thursday, pointing to a probable short-term reaction back within the Triangle first.

The factors that are bullish for gold here are that it has found support recently exactly at its 150-day moving average, from which it has rallied on no less than 6 occasions in the last 3-years, not including the recent reaction, as we can see on the 3-year chart for gold below. This means that the long-term uptrend remains unbroken. Another bullish factor that we can see on this chart is that the Accum-Distrib line has advanced to new highs, even as the Triangular consolidation pattern has developed. This is a very favorable sign. Finally the COT chart (not shown) is historically speaking certainly looking bullish, although not so outstandingly so as silver.

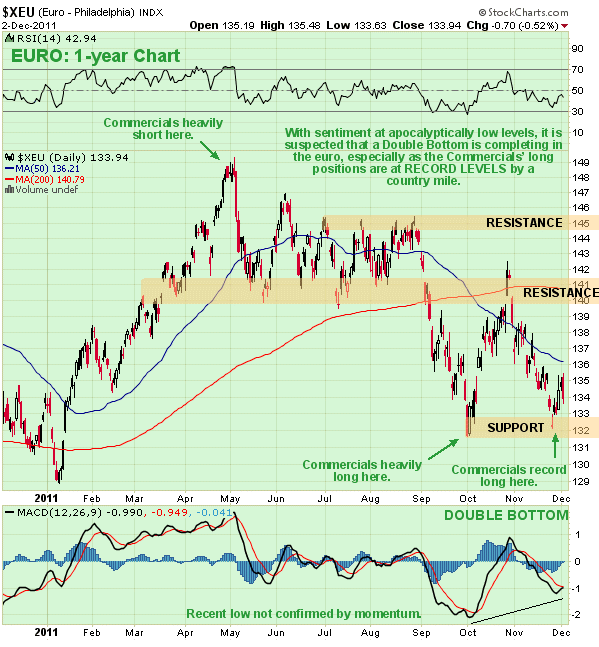
Someone wrote in to me to say that if they do massive QE in Europe. it will surely knock down the value of the euro, and so the dollar will rise, which is bad for gold. I responded that the euro is currently severely depressed due to the risk of its becoming a defunct currency, and that therefore it would benefit from a massive relief rally immediately it became apparent that the global banks were going to come riding to the rescue of Europe, regardless of the prospect of its later being devalued by money printing. This is certainly what the Commercials appear to be thinking for as we can see on the latest COT chart for the Euro FX, they are massively long the euro, with their holdings now at record levels by a country mile. Given that these people are seldom if ever wrong on the big moves, it looks like a big rally for the euro is brewing, regardless of all the current doom and gloom.

Thus it is interesting to observe on the euro chart that it appears to be completing a Double Bottom formation, with downside momentum having eased on the latest drop. The euro is certainly oversold on this chart with plenty of room to rally.

If the euro looks set to rally - what about the dollar. The dollar chart appears to be the inverse of the euro chart, with a potential Double Top completing, and the latest rally not confirmed by momentum, as made clear by the MACD indicator at the bottom of the chart.

Conclusion: notwithstanding a possible minor short-term reaction, which is suggested by the action late last week, it looks like gold is limbering up to break out upside from a large consolidation Triangle, which could be preceded by a false break to the downside first, as sometimes happens when a breakout does not occur until the price is almost at the apex of the Triangle, as is the case here. A clear breakout should lead to another major uptrend taking gold comfortably to new highs and probably above $2000 on this run. Downside risk will be reduced when the price succeeds in breaking above resistance at $1800, and a close above this level will be a good point to add to longs. As a big move one way or the other is likely soon, this is one of those rare times when straddles, in gold itself or gold proxies like some ETFs, are an effective strategy, and after last week's rally the short side of the trade, which may be used to protect existing holdings, is cheap.
With Europe teetering on the verge of collapse, the world has been teetering on the verge of a deflationary implosion, and it still is. That is the reason for the recent severe downdraft in the markets. What is believed to be happening now is that the global banking elites, who ARE the de facto government in many countries, like the US, are scrambling to prevent the collapse of their European division. The stakes are immense - if they succeed they "will kick the can down the road" and push all or much of the banks' bad debts off onto the electorate and taxpayers via austerity measures, bailouts and tax hikes and the course will be set for a hyperinflationary depression, if they fail then we will see the more immediately dramatic and much feared deflationary implosion.
As we will see Smart Money appears to be betting on the banks succeeding in their objectives. Why shouldn't they? - as noted above they are the de facto world government and thus their will should prevail. If Germany and Mrs Merkel, fearing hyperinflation, try to stand in their way, force will be brought to bear - a few more failed bond auctions ought to do the trick. With regards to the banks' power it is interesting to note that Goldman Sachs has more power in the US than the entire US electorate, until the latter become mobilized that is.
The sudden realization that the global banks are about to come riding to Europe's rescue is what caused the strong rally across world markets last week, and although the markets look set to take a breather, it looks likely that they will continue higher as the bailout process gains traction. Other aspects of this fundamental situation that are equally applicable to silver are discussed at some length in the parallel Gold Market update and we will now turn to examining the latest silver charts.
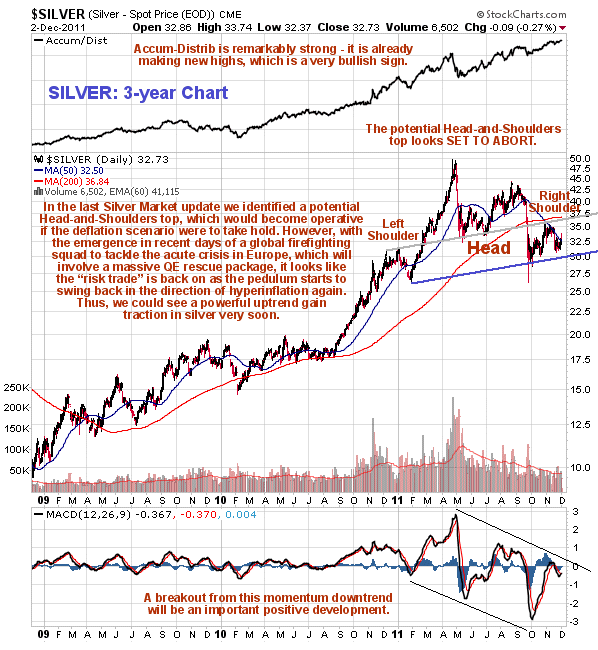
Superficially silver still looks pretty sick on the charts and weak compared to gold. However, the more closely you look at it, the more bullish the picture becomes. In the last update we had identified a potential Head-and-Shoulders top in silver on its 18-month chart, which would - and still could - become operative if Europe founders and the deflationary scenario prevails. However, the events of last week are evidence that a rescue is in its early stages, and that large scale money creation is on the way in order to faciliate this. This being so the potential H&S top looks set to abort, and there are some important indications that Smart Money has positioned itself for this.

On the 3-year chart for silver we can see the potential Head-and-Shoulders top, but we can also see that volume indicators are strong, relative to price, particularly the Accum-Distrib line which rather incredibly has been making new highs just over the past week or two, which is strongly bullish indication. A breakout from the momentum downtrend shown by the MACD indicator will be a sign that a major new uptend is getting started. The position of the silver price relative to its 200-day moving average gives us insight regarding its upside potential from here - it has gone from being way above its 200-day moving average late in April to being some way below this average now - so clearly there is room for a big move up from here.

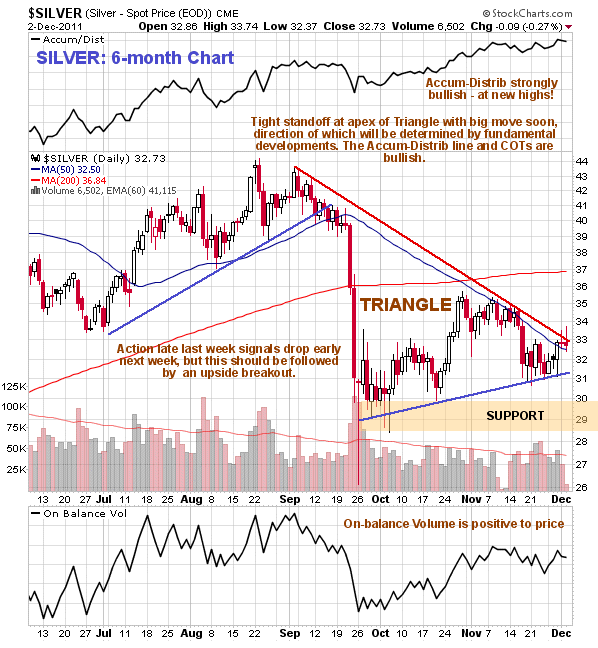
On its 6-month chart we can see that the silver price is currently being contained within the boundaries of an irregular triangular pattern that parallels the more symmetrical one that has formed in gold during the same period. Contact with the upper Triangle boundary and the falling 50-day moving average in November resulted in the price being forced lower again, and also resulted in a failed breakout attempt from the Triangle on Thursday and Friday of last week. However, the Triangle is now rapidly closing up so a breakout MUST occur soon, and while the rather bearish action late last week does suggest a short-term minor reaction, a decisive upside breakout is expected to occur soon, even if it is preceded by a false downside break. In addition to the positive volume indicators, especially the Accum-Distrib line, another factor pointing to the probability of an upside breakout is the fact that the price and 50-day moving average are now quite some way below the still rising 200-day moving average, which was not the case early in November when the price got turned back down.

With Commercial short positions and Large and Small Spec long positions having dropped back towards their recent extremely low levels over the past couple of weeks, the COT structure certainly looks highly favorable for a major uptrend to get underway soon. When these extremely low levels persist for weeks but the price doesn't advance it is easy to get skeptical about their implications, we have ourselves. We should not allow ourselves to fall into this trap - by the standards of recent years these readings are very bullish indeed.
Conclusion: we are believed to be at a very good entry point for silver and silver related investments here, especially if we see a short-term dip, as a major uptrend is expected to get underway soon.
Clive Maund, Diploma Technical Analysis
[email protected]
www.clivemaund.com
Copiapo, Chile, 5 December 2011


