Gold Market Update
Some readers may have seen a trades list produced by Goldman Sachs recommending that investors short gold next year. This report has been allocated to the circular filing along with the government inflation statistics.
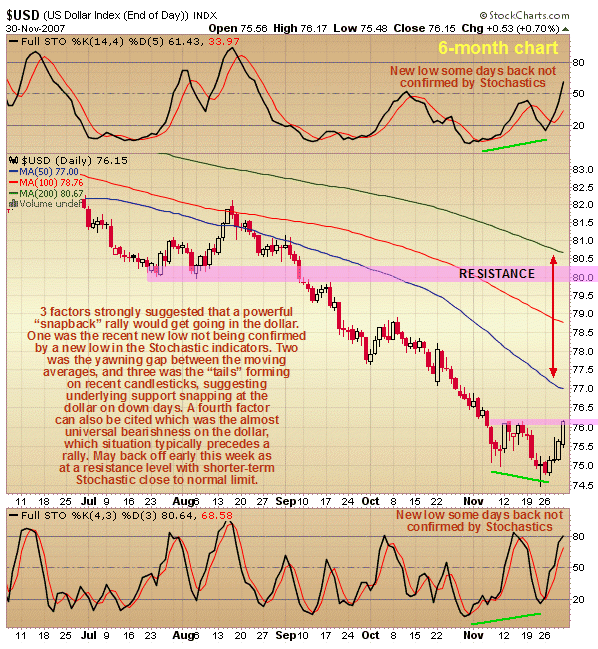
With the dollar rally predicted on www.clivemaund.com early on Thursday getting underway immediately afterwards, the question is how far this rally will carry, and how much further gold and silver will react as a result.


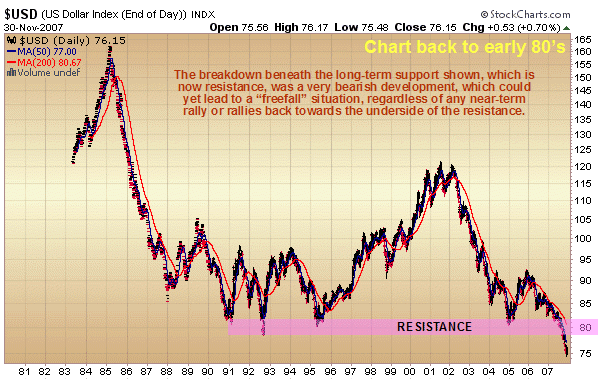
As set out in that article, while the current dollar rally could of course stop in its tracks at any time, it is likely to be significant for the reasons then given, which briefly were the non-confirmation by Stochastics of the recent new low, the large gap between the 50 and 200-day moving averages, and the evidence of rather aggressive buying in the candlestick pattern over the past several weeks, in addition to which sentiment regarding the dollar has been so negative in recent weeks that it could hardly get worse - a situation which typically precedes a rally. However, we can be reasonably sure that any rally won’t get above 79 - 81 on the index, which is the important multi-year support level that the dollar broke decisively below 2 to 3 months ago, and which is now a strong resistance level. Furthermore, all rally attempts so far this year have stalled out in the vicinity of the 100-day moving average, which is now below 79, so taking both these key factors into consideration, it seems most unlikely that the current rally will get any higher than 79. It is important to remember that this is viewed as the MAXIMUM that the dollar can achieve over the short to medium-term, and that the overall picture remains very bearish, with all moving averages falling, and key multi-year support having failed. Thus this rally, which in any case will only be due to a bout of panic short-covering following a period of extreme bearishness, can be expected to be followed by renewed decline which should take the dollar to new lows.

We will turn now to consider how much further gold is likely is likely to react in the event that the dollar continues higher over the short to medium-term, and for this purpose we will use a 3-year chart in order to maintain an overall perspective.
The first and most important point to make is that the strong advance by gold throughout September and October and into early November involved a breakout from a consolidation pattern lasting approximately 15 months, and is regarded as the FIRST UPLEG of a major uptrend. This being so the current retreat is viewed as a reaction, not a top, so the only question is how far it runs before gold takes off again to the upside. As with the major uptrend of late 2005 - early 2006, the price should at intervals test support in the vicinity of its 50-day moving, as it is doing now, and this average can be expected to maintain a fairly large gap with the 200-day until the advance has run its course, which is believed to be a long way out yet. So, bearing in mind what was written about the dollar above, and gold’s propensity to “telegraph” action in the dollar, how much further is it likely to react before the advance resumes? The answer is about $765, with $10 leeway either way, and it will have to be watched closely because once it reverses to the upside it is likely to be fast. If gold does drop back to the $765 area there is likely to be a sharp but brief shakeout in Precious Metals stocks, which should prove to be a significant buying opportunity.
Silver Market Update
Clive Maund
There are various general points set out in the Gold Market update, relating to the dollar, that are equally applicable to silver, so this Silver Market update will only focus on the detail differences particular to Silver.

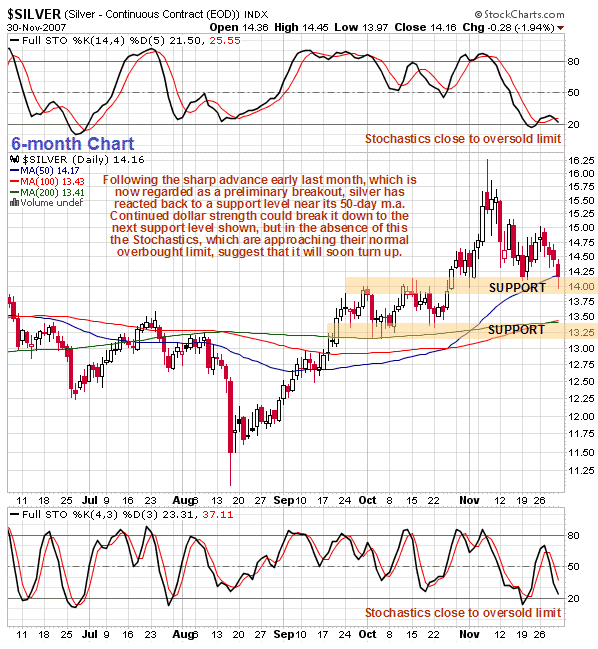
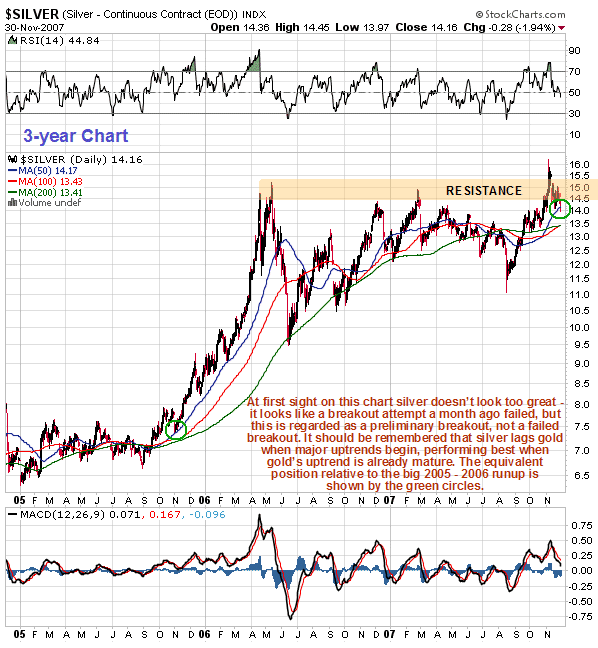
Silver’s attempt early last month to break out above its highs of last year is not regarded as a failed breakout, but rather as a preliminary breakout. The reaction since that time has completely neutralized the overbought condition and brought Stochastics back close to their normal oversold limit, as shown on the 6-month chart presented here, and brought it back to a zone of support at the top of the late September - early October trading range, so that the reactive phase is now believed to be close to complete. However, if we see further dollar strength as expected, silver could drop back more to strong support in the $13.25 - $13.50 zone, where it should be a buy for a renewed uptrend as the dollar rolls over and heads south again - if we don't silver should lift off again from here.

Clive Maund, Diploma Technical Analysis
Copiapo, Chile, 2 December 2007


