Gold Market Update
Price and volume action in gold in recent weeks has been very bullish indeed, as it moves towards completion of its giant 4-year long Head-and-Shoulders base pattern. We can see this to advantage on gold’s 10-year chart shown below. The volume pattern and volume indicators give the game away, and confirm that this is a genuine base pattern that will lead to a major new bullmarket in gold. Observe the volume build on the strong rise out of the lows of the “Head” of the pattern early last year, and how its even stronger on the rise this year out of the Right Shoulder low, and especially on the rally of recent weeks – the Accumulation - Distribution line has already reached its bullmarket highs of 2011, which is clearly a very positive sign. The new bullmarket hasn’t officially started yet of course and won’t until the price breaks out of the base pattern by breaking above the 1st band of resistance shown on the chart. That means that the days left to accumulate investments in this sector at good prices are numbered.

About a week ago it looked like gold was going to roll over again and play dead as it had arrived at an important zone of resistance at its April and June peaks as we can see on its year-to-date chart, with the risk of its doing so being increased by the potential for a dollar rebound, which we will come to later, but it didn’t – instead it broke above this resistance to advance on strong volume, which drove volume indicators sharply higher, a bullish development. This has given gold a buffer to buttress it in the event of a near-term dollar bounce.

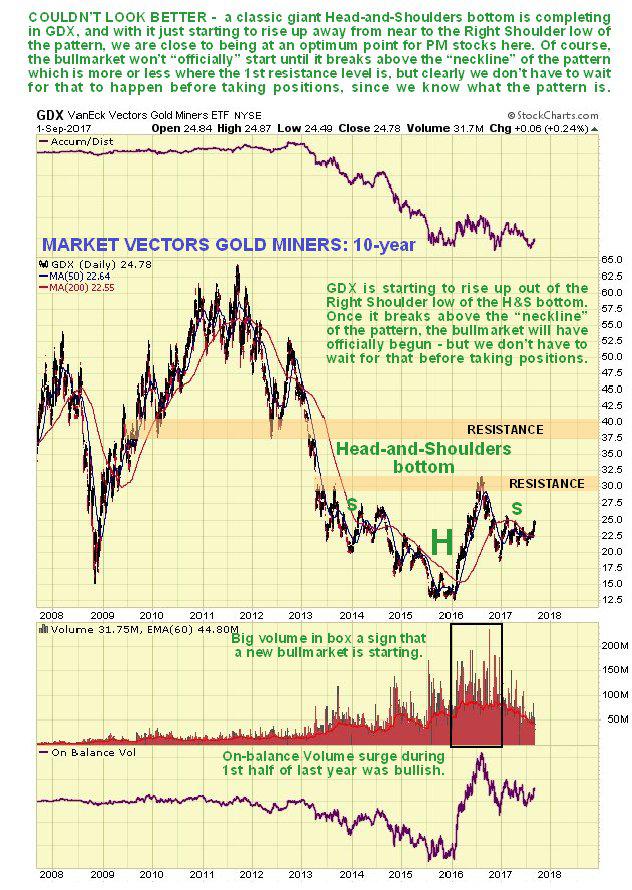
There is a parallel giant Head-and-Shoulders bottom pattern completing in gold stocks proxy GDX, as we can see on its 10-year chart below, and with the price still not far above the Right Shoulder low of the pattern and quite a way below its neckline (the 1st resistance level), we are still generally at a good point to accumulate Precious Metals stocks, as we have doing in recent weeks. The persistently high volume on the dramatic surge out of the lows of the Head of the pattern early last year was a sign that the bottom is in and was a very bullish development. The real big action will follow breakout above the 1st resistance level, although there will be considerable resistance to work through on the way up to the 2011 highs, but since the new sector bullmarket is set to be an order of magnitude greater than the last one, we can look forward to huge gains once GDX breaks out above its 2011 highs to new highs where there will be no further overhanging supply.

The gold charts that we have just looked at suggest that the dollar is destined for a serious breakdown, so now we will look at the latest dollar index chart to see what it portends. On the 8-year dollar index chart we can see that it has marked out a large Broadening Top over the past 2 years, which it is now threatening to break down from. However at this point is oversold and on support at the bottom of the pattern, making a near-term bounce likely, although if it happens, it probably won’t get very far.

Also pointing to a near-term dollar bounce is the latest Hedgers chart, which itself looks bullish for the dollar, and suggests that it is not ready to break down just yet. If it does bounce gold would be expected to pull back, but not by very much, to provide what will be probably turn out to be the last chance to accumulate the sector at favorable prices before the expected major bullmarket begins in earnest.
Chart courtesy of www.sentimentrader.com
********


