Gold Market Update
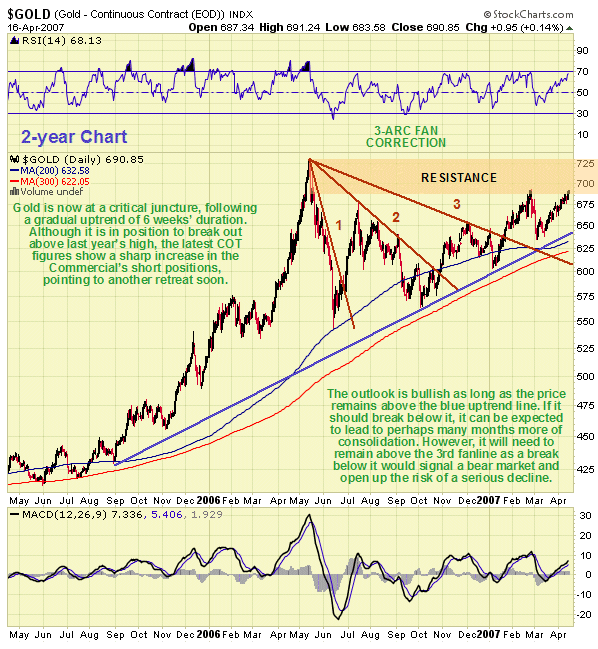
The gradual uptrend of the past 6 weeks has brought gold once again to a critical juncture. This rise has brought it up to the late February high and within $40 of last year’s highs at about $730, raising hopes that it may soon break out to a new high.

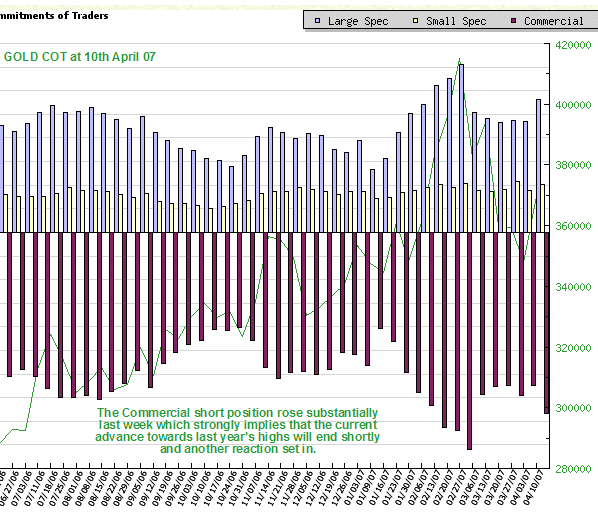
As we can see on the 2-year chart the current situation is rather complex. In mid-January gold broke out from a 3-arc Fan Correction, marking the start of another uptrend and after rising for a while it reacted to successfully test support above the 3rd fanline of the correction. It has since risen again, slowly and steadily, to attain the level of the February high at and above which there is strong resistance, which in itself is grounds for caution. The price has been shepherded higher since the October low by the trendline shown and the 300-day moving average, near which gold has found support throughout the bull market. On the face of it this is a bullish setup that should lead to an upside breakout and another strong uptrend. However, if we look now at the latest COT chart we can see that the warning bells are once again sounding loud and clear - the level of Commercial shorts increased substantially last week and is now at a relatively high level. So it looks like the price is going to fail again at the major resistance above $690 and turn tail and retreat, although this does not mean it has to break down below the important trendline in force from September 2005. The most likely scenario therefore is that gold will go into retreat shortly back towards the trendline currently at about $645, and if so we will want to see the Commercials’ short position moderate to prepare the ground for another challenge of the big resistance at and above $690.

If the uptrend is broken it will likely lead to a prolongation of the consolidation in force since May last year. The worst case scenario is that a double-top is forming with the highs of last year, but it would take a breakdown below the trendline to provide initial confirmation of that, and if that is followed by a break below the trailing 3rd fanline it would of course constitute a major sell signal.
We have been long up to this point, and without the deterioration revealed by the COT figures would have been prepared to wait to see if gold can break out above last year’s highs. Traders long gold here should be aware of this short-term downside risk and profits should be taken in gold stocks that have run up sharply over the past 6 weeks. At this point we are looking for a reaction, but it is not expected to be too serious, and should be followed by another challenge of the strong resistance at and towards last year’s highs.
Silver Market Update
Clive Maund
The silver chart looks considerably less inspiring than the gold chart at this juncture, which is perhaps not so surprising as after outperforming gold last year, it has been underperforming it so far this year. On the 10-year chart the trading range that has followed the ramp from September 2005 through April last year does not look to be of sufficient duration to support another strong advance, and the uptrend channel drawn on this chart looks unsustainably steep and for these reasons the chances of a breakdown are considered to be quite high.

On the 2-year chart we can see that silver is now rapidly approaching decision time - it must either break above last year’s highs soon or break down below the uptrend line shown. Observe that if it does break down here and the strong support in the vicinity of the 200-day and 300-day moving averages holds, the pattern could morph into a rectangular consolidation that leads to an upside breakout later, but should it drop below $12 it will likely plunge rapidly back to the next key support zone in the $10 area. Such a development would be expected to at least result in the price “retiring” into a much more drawn out consolidation pattern, and at worst it would signify the completion of a top area.

Traders can remain long here for a possible upside breakout, but should bail immediately if it breaks below the trendline shown, as this may lead to a plunge, a routine event with silver, as it tends to go down a lot faster than it goes up. If the support in the $12.20 - $12.50 area holds, positions can be re-entered with a stop below $12.
Clive Maund, Diploma Technical Analysis
Copiapo, Chile, 18 April 2007


