Gold Market Update
On 21st February an article was posted titled COMMERCIALS ON THE ROPES. This article was based on the erroneous presumption that “this time round it will be different” - that the COT pattern would be broken by a surge in physical demand. Well, as subsequent events have proved, this time round it wasn’t different, it was the same as it has always been. The Commercial shorts rose to a very high level and gold’s advance was killed and it went into sharp reverse. This was a serious error of judgment that will not be repeated.

The best way to relate the COT activity to recent action in gold is to proportion the COT chart and stack it directly below or above the gold chart for direct comparison as we have done here. What it reveals is clear and very dramatic. During the 1-year period of these charts we can see that each peak in gold was accompanied by a relatively high Commercial short level, and conversely, and even more clearly, each trough in gold was accompanied by a relatively low level of Commercial shorts. The very high level of Commercial shorts on the recent rally built to a peak - a record for the 12-month period - just before gold dropped steeply. However, the correlation is not always perfect and we can see that the Large Specs (shown in blue) basically got it right for much of the strong rally in April of last year and into May, during which time it was going against the Commercials.
A key point to glean from this chart comparison is that once the pendulum starts to swing away from an extreme in the COT structure, it normally takes quite a while before it starts to come back in the other direction. What this means is that, having suffered another defeat and been forced into retreat once again, it is likely to be some considerable time - i.e. months, before gold is able to take another crack at break higher - as clearly it will probably take many weeks for the Commercials high short position to be unwound. Thus gold looks set to remain moribund within the large trading range that is now 10 months long into the foreseeable future, and traders can play the swings, and there be some potentially very profitable option trades possible during this phase, which we will be exploring. For the 3-arc Fan pattern shown on the chart to remain valid, gold will have to remain above the 3rd fanline, which it is now not far above. It is now oversold and thus could rally shortly, although it is unlikely to get far. We will keep a close eye on the COT situation, which will assist in determining when gold is once again in condition to mount a significant rally. As with oil, only in the event of an imminent or surprise attack on Iran is the picture likely to suddenly turn bullish again.
It has crossed the writer’s mind that if a large number of traders were suddenly to cotton on to what is written here, which is blindingly obvious, and suddenly start following it, it would cause the patterns to mutate, so that using the COTs in this way would no longer work. Well, you don’t need to worry about that, because the most important thing to be learned from history is that people don’t learn from history. Only a small percentage of Precious Metal traders will read this, and most of those that do will forget about it in a few weeks. Those of us that do remember can therefore look forward to profitably using the simple correlations exposed here indefinitely into the future. That is just what we plan on doing.
Silver Market Update
Clive Maund
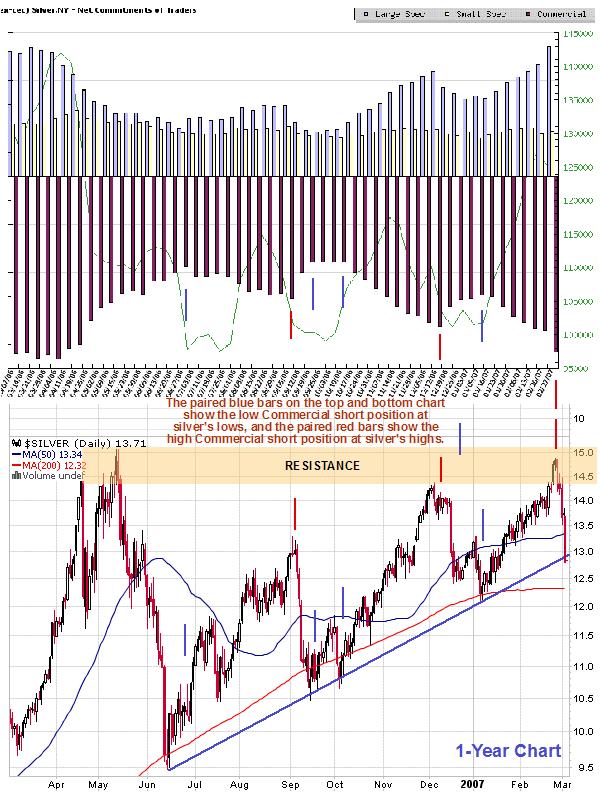
The arguments relating to the COT structure and its application as a predictive tool set out in the Gold Market update, apply equally well to Silver, so readers are referred to it for details. In this Silver Market update we will look briefly at specific developments in the silver chart over the past week. One big difference between silver and gold is that silver failed at resistance at its highs of last year, while gold never managed to get near to its highs. What this means is that silver is, as we have known for some time, outperforming gold, although that may seem rather academic right now.

On the combined COT and 1-year silver chart, we can see that the Commercials short positions jumped early last week, just before silver started its nosedive. The failure at the highs then led to another plunge, similar to those we have witnessed before, which has already brought silver down to break by a narrow margin the uptrend line shown on the chart. This plunge has broken the price down below the 3-arc fan drawn pattern shown on earlier charts, which has been invalidated, and thus removed. Silver is now short-term oversold so it may take a breather shortly.
This failure at the highs will of course have damaged sentiment, and for this reason alone considerable time will probably be needed for sentiment to recover sufficiently for it to mount another challenge of the highs. As with gold and discussed in the Gold Market update, it will take time for the Commercials to unwind their high level of short positions. Thus we can expect silver to remain bogged down in a large trading range probably for several months to come at least. During this time traders will be able to play the swings and make money out of options, while we wait for a more favorable COT pattern to slowly emerge. As with oil, only in the event of an imminent or surprise attack on Iran is the picture likely to suddenly turn bullish again.
Clive Maund, Diploma Technical Analysis
Copiapo, Chile, 4 March 2007


