Gold Market Update
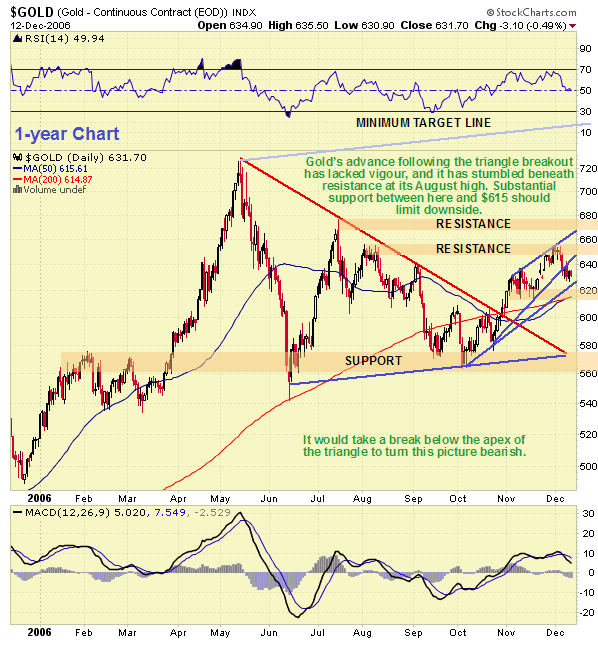
Although gold has not exactly glittered since it broke out of its large triangular pattern late in October, immediate downside now looks limited, while upside remains relatively unlimited.
We can see gold’s hesitant progress following the breakout on the 1-year chart. One big reason for the slow progress is that it has been working off resistance in the vicinity of its August and September highs. Another positive effect is that the 50-day moving average has now caught up with the 200-day, meaning that the moving averages are in better alignment to support continued advance.

One leading writer recently argued that gold has broken free of its inverse correlation with the dollar. Common sense dictates that this can at best only be partly true, as it is priced in US dollars - you know yourself that if you go down to the river and swim downstream, you are going to make far more progress than if you attempt to swim upstream. Thus the outlook for the dollar must continue to have an important bearing on gold’s fortunes. We will therefore have a look at the US dollar.
The 1-year dollar chart shows the savage breakdown from a triangular consolidation pattern in mid-November. The ferocity of the plunge clearly has bearish implications, although the oversold condition that resulted and the proximity of strong support towards 80 on the index means that it is entitled to stage a relief rally, which is what has begun in recent days. The severity of the breakdown in November, which smelt of panic, implies that any rally here will be killed by the considerable supply overhang and is not going to get very far, and if the dollar succeeds in approaching the underside of the triangle it will regarded as an excellent shorting opportunity.

An Elliot waver wrote to advise me that according to his wave count the dollar had hit bottom and with everyone and his mother bearish on the dollar it is about to rally. While he may have a point with regards to sentiment - we have the trading mechanisms in place to stand aside and avoid being steamrollered if he proves to be correct as we are not in the business of sacrificing ourselves on the altar of “it’s going to be different this time around” - the implications of the action in November are that it very well could be different this time around. Certainly, the support at and towards 80 on the US dollar index is very strong indeed and should not be underestimated, but it looks like it is going to be subjected to a severe testing in the months ahead and may fail, which would have grave implications for the currency.
Having noted the probable limited upside for the dollar, let’s now return to consideration of the gold chart. We can see that there is a lot of support between the current price and about $615, arising first from the lower intermediate uptrend line, and then from the rising moving averages and the clear support line at $615, which supported the price in early-mid November. Gold is regarded as a buy whilst in this support zone, although a trading sell signal would be generated by a clear break below $615, which would project the price down towards the strong support at the apex of the large triangle, in the $560 - $580 zone, a failure of which would, of course, be bearish. But as long as $615 holds we remain bullish, and once the resistance at the July high towards $680 is overcome, the advance can be expected to accelerate significantly.
Silver Market Update
Clive Maund
Silver continues to look substantially stronger than gold, having put in a much better performance since it broke out from its large triangle pattern late in October, this outperformance being presaged by silver’s triangle being upwardly skewed compared to gold’s. Silver has broken above its early September highs, while gold has failed to break above its July highs and its lower August highs, and silver has come quite close to challenging its April - May peaks, which gold is a long way from doing. This strength is also reflected in the fact that silver has remained within a parallel uptrend channel and has lost little of its late November gains this month, while gold has lost the lot. The obvious conclusion to be drawn from this is that Precious Metals investors should be more heavily weighted in silver, at least until this disparity shows signs of closing up.

We can see all of the above on the 1-year silver chart, and also that following good gains in mid-late November, silver has had a mild reaction back towards the lower channel line of its intermediate uptrend, which has served to unwind the overbought condition somewhat. From here it is expected to make another run at the overhead resistance at the April - May highs, although traders should stand aside in the event of the uptrend channel failing, which may create the opportunity to re-enter later at better prices.
Clive Maund, Diploma Technical Analysis
Kaufbeuren, Germany, 14 December 2006


