Gold Market Update - Post Breakout Reaction Provides Another Buying Opportunity...
The last update was prescient as it called for a major breakdown in the dollar and breakouts by gold and silver, all of which happened just days later. If this were 2010 or 2011 this update would have generated considerable interest and numerous emails, but today nothing – it was greeted with a yawn. This means one of two things or a combination of the two – either American investors and others are now broke and have no money to invest, hence no interest, or sentiment towards the Precious Metals sector is now so negative after recent underperformance that there is no enthusiasm for it. I believe that the explanation is largely the latter reason, in which case it is exceedingly bullish, because the more negative the sentiment towards a sector the more upside potential it has, and I saw an article or video confirming this a few days ago because it described the rally this month as a “bull trap”.
I think that it is exceedingly unlikely that the rally is a bull trap for several important reasons. The first, as set out in the last update, is that sentiment towards the sector is still awful with the normally wrong Large Specs’ long positions being almost non-existent. Second, other countries and trading blocs are now raising their interest rates so that they are catching up to or overtaking US rates, reducing the incentive to go for dollar denominated assets. Thirdly, money creation everywhere is going parabolic with the result that we are moving rapidly towards hyperinflation and fourthly China and Russia may soon “drop the hammer” and launch a gold-backed currency, which they have been moving towards for years, that will drive a stake through the dollar and finish it off.
The long-standing dream of the old style Neocons in the US is to attack Russia, subdue it and assimilate it, through sanctions and military action, a plan which they have clearly put into action via the proxy war in the Ukraine, and having accomplished that to encircle China and force it into submission after which the hegemon will control the entire world. It is this fantasy that has produced the crude threats issued to China over Taiwan, but as anyone who has read “The Art of War” knows, you do not issue crude threats to a country that is both very powerful and sophisticated. China and Russia are allies with the former closely associated with the World Economic Forum whose plans to implement the Chinese social credit system across the entire world are well advanced. The United States is slated for destruction and is already being torn down by massive unchecked immigration, the bizarre and dysfunctional woke culture that has led to the country being administered by crooks and freaks, economic sabotage of supply chains and the food supply etc. and the forced vaccination of its military personnel with poisons that will kill or incapacitate many of them, but by far the simplest and most effective way of ending its power is to end the dollar as the world reserve currency. Once that happens the US will no longer be able to exchange piles of intrinsically worthless paper for the goods and services produced by the rest of the world and will rapidly become a banana republic, kind of like Haiti but without the mild Winter climate. China and Russia have been moving towards this goal for many years, which is why they have been accumulating vast quantities of gold at knockdown prices in preparation for the day when they will launch a gold-backed currency that will see the unbacked dollar become worthless at astonishing speed. They have been waiting for the right moment, and with the Fed doubling the amount of dollars in existence every few years now that time is believed to have arrived. The imminence of this may explain why the dollar tanked this month.
Since the outlook for the dollar is key to everything else we are going to look at, especially gold and silver of course, we are going to start by looking at the dollar index charts.
On the 6-month chart we can see how the dollar index crashed support in the 109 – 109.30 area over a week ago which led to it dropping sharply to support just above the rising 200-day moving average. There are many out there who believe that this was just a somewhat larger correction than normal that will be followed by renewed advance, but as we will see there were many aspects of this drop which signify that a major technical failure has taken place. In the first place one of those down days involved a massive drop of over 2% that signifies massive dumping and is therefore bearish. Next the drop caused a massive momentum failure which has switched the larger trend decisively from up to down. While there can be no doubt that the dollar is heavily oversold here on a short-term basis, that does not mean that it won’t drop further in a panic selloff situation that we may now be in, and thus it is interesting to observe that the pattern that has formed in recent days following the sharp drop looks very much like a small bear Flag that will soon lead to another heavy drop, probably of similar magnitude to the first – and if the strong support near to the 200-day moving average fails to hold, the ground could open up beneath it.

A big reason that the severe breakdown of the dollar was called before it happened is that it was observed on the 5-year chart that the dollar was in the late stages of a parabolic slingshot blowoff move. When it did break down, the drop was precipitous, indicating that our parabolic uptrend was valid and of major importance. This breakdown means that the dollar’s bullmarket is very probably over, even if we see some sort of countertrend rally in coming weeks gto alleviate the heavily oversold condition.
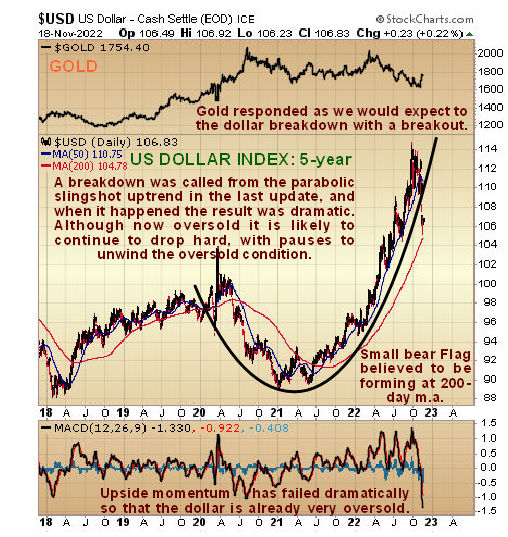
Having looked at these 2 charts for the dollar it should now be abundantly clear to you why gold and silver have broken out to start a major new bullmarket, and thus that any minor dips, such as the one now occurring as a result of the dollar’s feeble and diminutive countertrend rally are there to provide us with opportunities to build positions in better stocks across the sector.
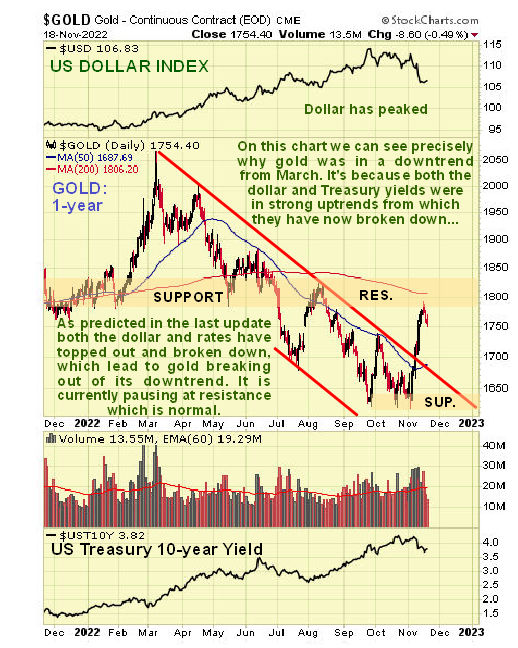
On gold’s 1-year chart we can see how the dollar’s breakdown triggered a breakout by gold from its downtrend in force from last March. The current minor reaction is not expected to carry far before the next impulse wave kicks in.
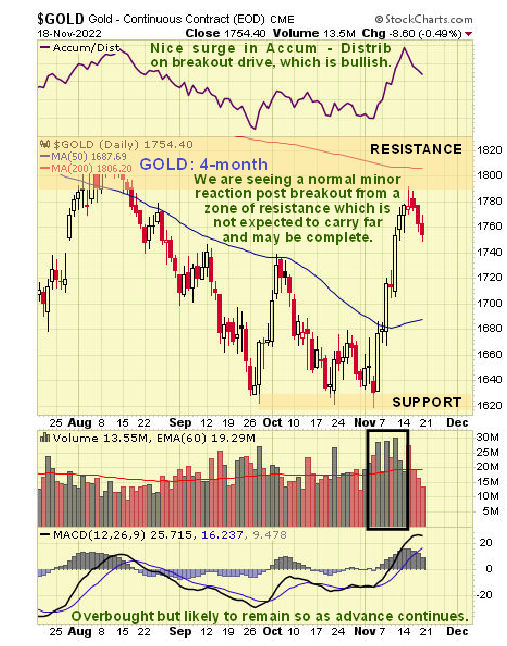
On gold’s 4-month chart we can see recent action in much more detail and how the strong volume on the breakout move drove the Accumulation line sharply higher which is bullish and further suggests that an important change of trend has occurred…
In the last update we had seen the breakout from the Head-and-Shoulders bottom that had formed within the curved downtrend in GDX coming. On the 1-year chart we can see this downtrend in its entirety and how the breakout was decisive and on good volume. Now we are seeing a normal post-breakout reaction that it not expected to carry far before the next impulse wave kicks in and it could kick in immediately.

On the 4-month chart we can see the Head-and-Shoulders bottom in much more detail and the strong volume driving the breakout move. Note the “head fake” sharp drop early this month which threw a lot of investors. Such moves are often engineered by Big Money to wrong foot crowds of smaller investors.

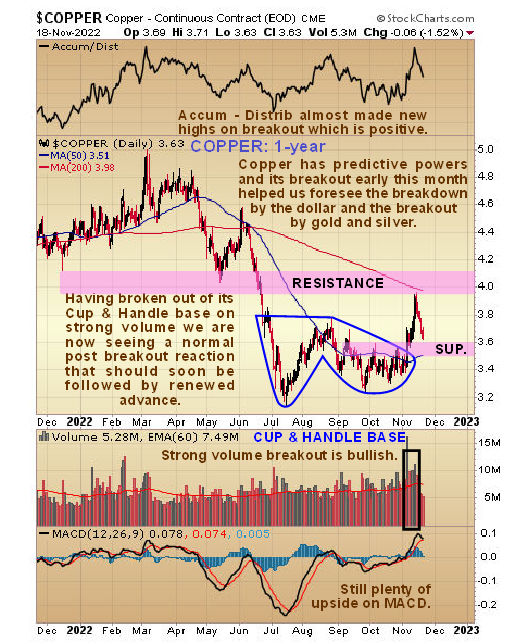
Copper is known for its predictive powers, hence its nickname Dr Copper and it was the first of the metals to break out and it assisted us in figuring out that gold and silver would soon break higher too, so it is worth taking a quick look at it to see how it is getting on. On the 1-year chart we can see that after breaking out, it ran quickly to a zone of resistance near to its falling 200-day moving average, which turned it lower and we have since seen a normal reaction back to support near to the breakout point, where it – and copper stocks generally - looks like a buy again.
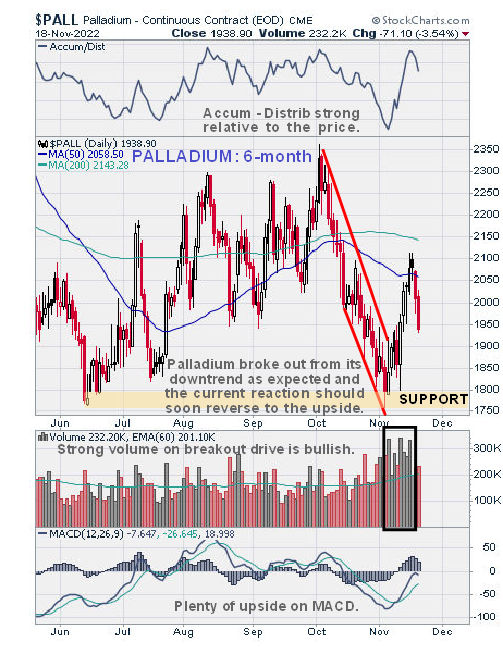
Lastly we’ll take another quick look at palladium as we looked at it in the last update and decided that it was on the bottom and ready to reverse to the upside. On its latest 6-month we can see that it has done exactly that and after running up to the $2100 area it has reacted back in sympathy with other metals. The strong upside volume on the advance that drove the Accumulation line sharply higher is bullish and suggests that it will go on to exceed the August – October peaks shown on this chart. Although it could react back further short-term the look of the dollar chart suggests that, in common with other metals, it will turn higher here or soon and it is thus rated a buy here and especially on any further near-term weakness.
********


