Gold Price Forecast: Still Hiding? Bears, Get Out Of Your Dens!


 I could write a nice lengthy introduction today, but it seems that there’s only one question on your mind right now, so I’ll quickly address it instead. Has the outlook for gold, silver, and mining stocks become bullish because of Monday’s rally? My answer is: no, it hasn’t changed.
Let’s jump into the charts.
Support the Dollar

The USD Index invalidated the breakout to new 2021 highs, but it didn't invalidate the previous inverse head-and-shoulders pattern, so the downside seems very limited.
There’s a rising short-term support line based on the June and July lows that currently “says” that the USD Index is unlikely to fall below ~92.75. At the moment of writing these words, the USD Index is trading at about 93.07, so it’s very close to above-mentioned level.
And even if the USDX declines below it, there’s support at about 92.5 provided by the neck level of the previously confirmed inverse head-and-shoulders pattern. This means that the USDX is unlikely to decline below this level, and this in turn means that the downside seems to be limited to about 0.6 index point. That’s not a lot.
Remember when the USD Index previously invalidated the breakout above the inverse H&S pattern? I wrote then that it could decline to the nearest support level provided – then – by the 38.2% Fibonacci retracement. Now the nearest support is provided by the rising support line at about 92.75.
This doesn’t mean that gold will necessarily rally from here or that the rally will be substantial. On the lower part of the above chart, you can see that gold moved to its declining resistance line, which means that it could decline right away. We can see it more clearly on the gold chart below.

In this case, I marked the declining short-term resistance line with blue. The combination of the resistance line being reached with the fact that gold did that right on its reversal day indicated by the triangle’s vertex makes it even more likely that gold will reverse its course shortly.
We can see the same thing – gold moving to its resistance line – also when we look at its performance through its most popular proxy – the GLD ETF.

In this case, we can compare where gold rallied to where the mining stocks (the GDX ETF) rallied. And while the GLD moved to its declining resistance line, the GDX ETF was not even close to its analogous dashed declining resistance line.
Instead, the GDX ETF moved back to its previously broken neckline of the head and shoulders pattern and closed slightly below it.
This is more important than comparing the GDX’s closing price to its previous yearly low — it closed slightly above it.
The 2013 Analogue Still in Play
And speaking of mining stocks, the HUI Index closed slightly above its previous March lows (in terms of the closing prices), but it was just 0.24 index point rally above it.

Consequently, it’s not appropriate to say that the breakdown was truly invalidated. It’s kind of a “gray area” of invalidations. That’s not the most important point of view though.
The most important point of view is the broad point of view.
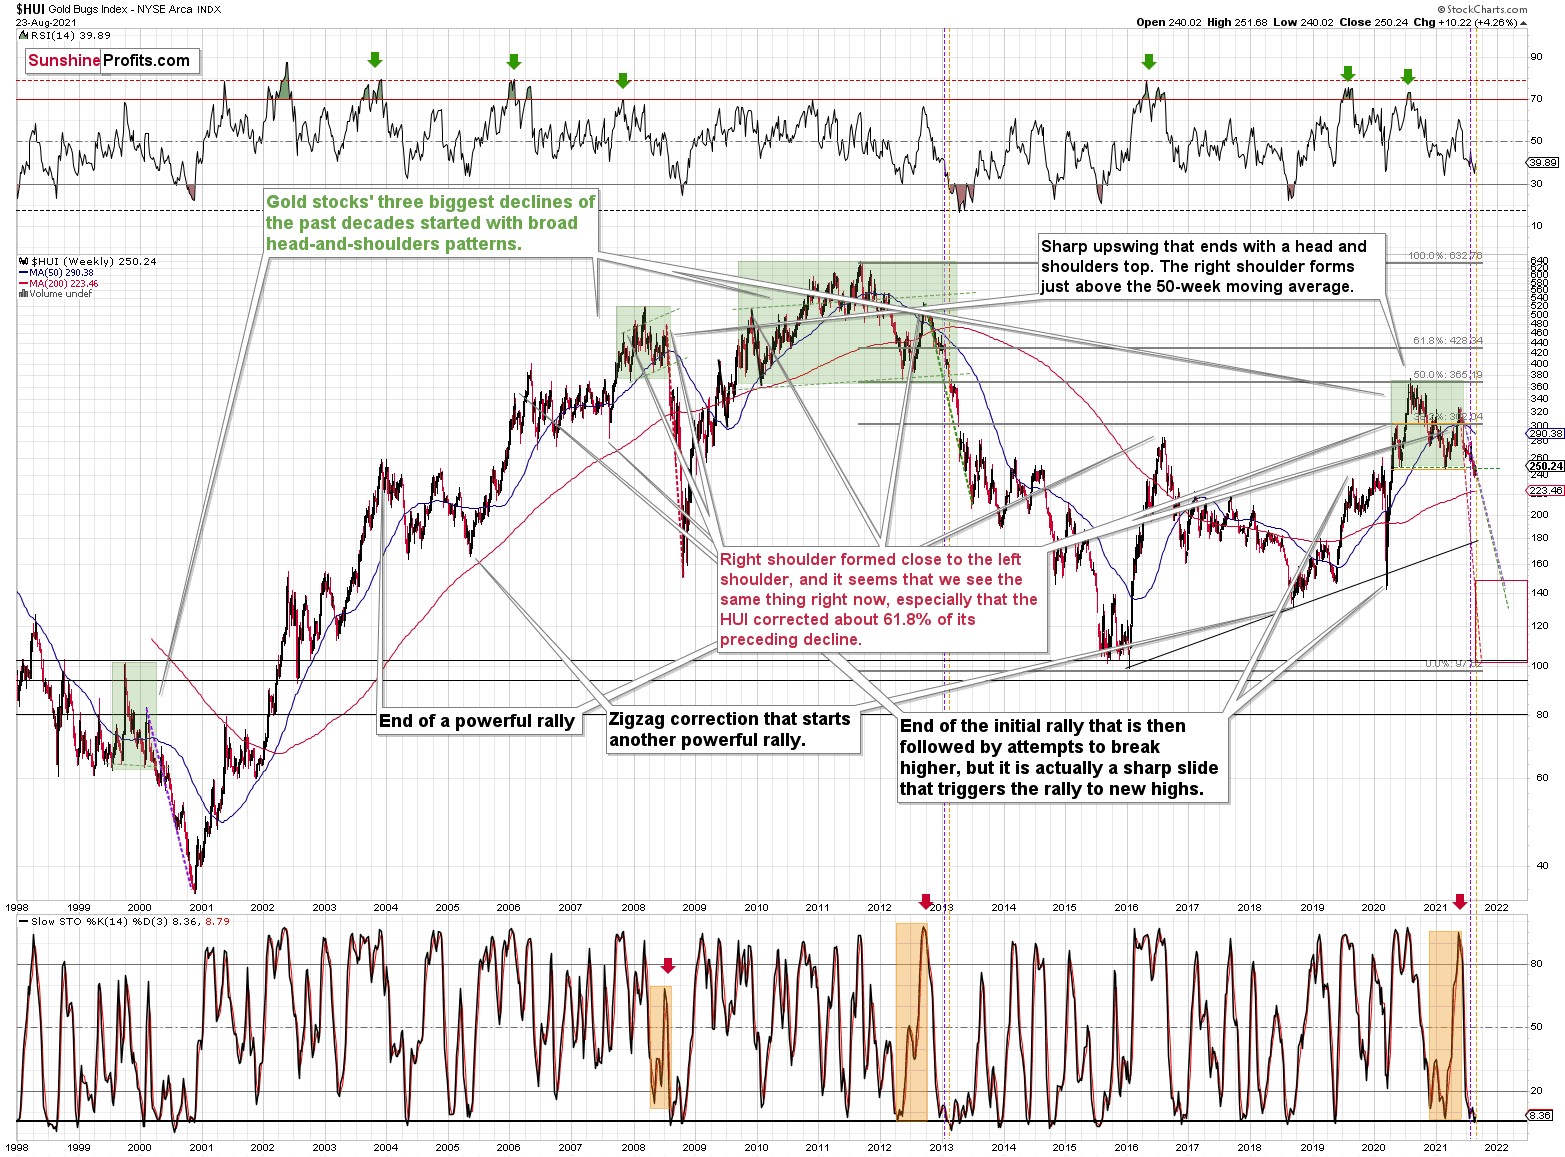
Do you see any change with regard to the similarity between now and what happened in 2013? No? Because nothing changed with regard to it.
It’s useful to keep in mind that the current post-broad-head-and-shoulders pattern is not only similar to what happened in 2013 but also to what happened in 2008 and… in 2000. In the case of the former, there were ~4%-8% corrective upswings after the breakdown below the H&S pattern. In the case of the 2008 slide, there was no short-term correction, and in the case of the 2000 decline, there was even a corrective upswing that pretended (!!!) to invalidate the head and shoulders pattern, after which the HUI Index declined about half of its value.
Gold stocks moved higher about 4% so far this week. This is in perfect tune with what happened in 2013 and in 2000.
In fact, let’s check what exactly happened in 2013 in the GDX ETF.

Right after breaking below the previous lows, there was a ~4% rally that took the GDX ETF above the previous low in terms of the closing price, but only slightly so. Seems familiar?
Yes, that’s exactly what happened yesterday.
If the analogy to 2013 is being repeated almost to the letter, should this performance be really treated as something bullish? No.
Summary
To summarize, the medium- and short-term outlooks for the precious metals sector remain down. The breakdown to new yearly lows in the HUI Index and to new yearly highs in the USD Index serve as profound confirmations that a huge downswing in the precious metals sector is underway and that its biggest part is likely just ahead. Regardless of yesterday’s upswing in the PMs and miners.
And as silver often moves in close relation to the yellow metal, when gold falls, Silver is likely to decline as well – it has probably already started its slide. The times when gold is continuously trading well above the 2011 highs will come, but they are unlikely to be seen without being preceded by a sharp drop first.
Thank you for reading our free analysis today. Please note that it is just a small fraction of today’s all-encompassing Gold & Silver Trading Alert. The latter includes multiple premium details such as the outline of our trading strategy as gold moves lower.
If you’d like to read those premium details, we have good news for you. As soon as you sign up for our free gold newsletter, you’ll get a free 7-day no-obligation trial access to our premium Gold & Silver Trading Alerts. It’s really free – sign up today.
Przemyslaw Radomski, CFA
Founder, Editor-in-chief
Sunshine Profits - Effective Investments through Diligence and Care
* * * * *
All essays, research and information found above represent analyses and opinions of Przemyslaw Radomski, CFA and Sunshine Profits' associates only. As such, it may prove wrong and be subject to change without notice. Opinions and analyses are based on data available to authors of respective essays at the time of writing. Although the information provided above is based on careful research and sources that are deemed to be accurate, Przemyslaw Radomski, CFA and his associates do not guarantee the accuracy or thoroughness of the data or information reported. The opinions published above are neither an offer nor a recommendation to purchase or sell any securities. Mr. Radomski is not a Registered Securities Advisor. By reading Przemyslaw Radomski's, CFA reports you fully agree that he will not be held responsible or liable for any decisions you make regarding any information provided in these reports. Investing, trading and speculation in any financial markets may involve high risk of loss. Przemyslaw Radomski, CFA, Sunshine Profits' employees and affiliates as well as members of their families may have a short or long position in any securities, including those mentioned in any of the reports or essays, and may make additional purchases and/or sales of those securities without notice.
********
 Przemyslaw Radomski, CFA, is the founder, owner and the main editor of SunshineProfits.com. You can reach Przemyslaw at: http://www.sunshineprofits.com/help/contact-us/.
More from Gold-Eagle


