Gold: Reversal Signals are Increasing
 share
share
 share
share
 share
share
 share
share
 share
share
The gold market’s meteoric rise over the past seven-and-a-half months has been nothing short of extraordinary. Fueled by heightened geopolitical tensions and robust central bank buying, gold prices smashed through resistance around USD 2,075 to new record highs above USD 2,450 per ounce. While economic fundamentals in major western economies would typically weigh on gold, the safe-haven demand stemming from the Iran-Israel conflict as well as the physical buying in Asia have proven to be the overriding factors driving this relentless bull run. As long as geopolitical risks remain elevated, gold is likely to retain its upward trajectory, with banks like Goldman Sachs forecasting prices to reach USD 2,700 by year-end. This surge has not only highlighted gold’s enduring status as a crisis hedge, but also its increasing prominence as a reserve asset for central banks looking to diversify away from the U.S. dollar. Nevertheless, the gold bull seems to be getting a bit tired in the short-term and might soon need a breather to recharge for the next ascent.
Review
Starting from a new all-time high of USD 2,431 on April 12th, the gold market experienced a significant pullback from mid-April onwards. This was marked by two waves of selling: the first from USD 2,431 down to USD 2,325, and the second from USD 2,419 down to USD 2,277, which created considerable uncertainty among market participants.
Although the psychological threshold of USD 2,300 was breached several times during this pullback, the bears were unable to generate further selling pressure. Instead, the oversold conditions, beginning from the low of USD 2,277 on May 3rd, led to a bear trap, followed by a substantial recovery and a new all-time high of USD 2,450 on May 20th.
In hindsight, the USD 154 correction in April has proven to be a healthy pullback, even though it briefly appeared to signal the end of the rally that started in early October.
Silver has taken the lead
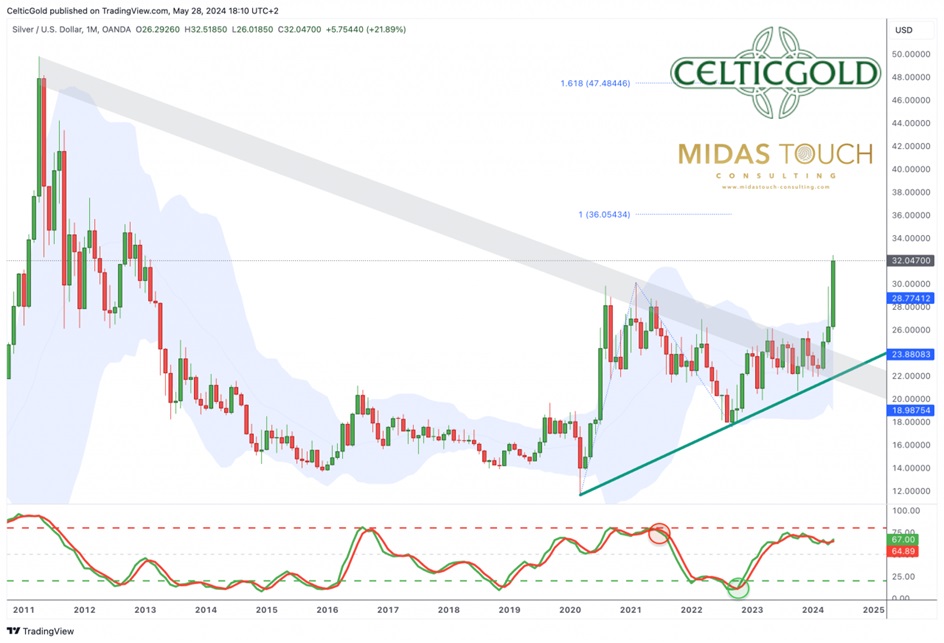
Silver in US-Dollar, monthly chart as of May 28th, 2024. Source: Tradingview
Meanwhile, silver prices have taken the lead since their low of USD 26 on May 2nd. Over the past three weeks, silver has not only surged significantly but has also effortlessly surpassed the resistance zone around USD 30, which had been intact since August 2020. With an interim high of USD 32.49, silver prices reached their highest level in over 11 years on May 20th. Silver enthusiasts had been waiting a long time for these price levels.
The clear breakout above USD 30 has significantly improved the technical outlook for silver. Despite another pullback to the breakout level around USD 30, the silver price is expected to reach USD 35 in the short- to medium-term. A direct march to the all-time high of USD 50 cannot be entirely ruled out in the short term but should be anticipated within the next 6 to 24 months.
Despite weakening economic data and disappointed interest rate cut expectations, which should have gradually weighed on financial markets from early May, precious metals, stocks, and Bitcoin have held up well so far. In a crack-up boom, liquidity and money flow are crucial, and these factors continue to favor higher prices for the time being.
However, the latest pullback from USD 2,450 to USD 2,328 once again makes it clear that the upward movement is not a one-way street. Prices moving below USD 2,330 again, however, would be a significant indication that an important interim high was reached on May 12th, and that the gold price has already entered the typical early summer correction phase.
Chart Analysis – Gold in US-Dollar
Weekly chart: Stochastic still bullish embedded.
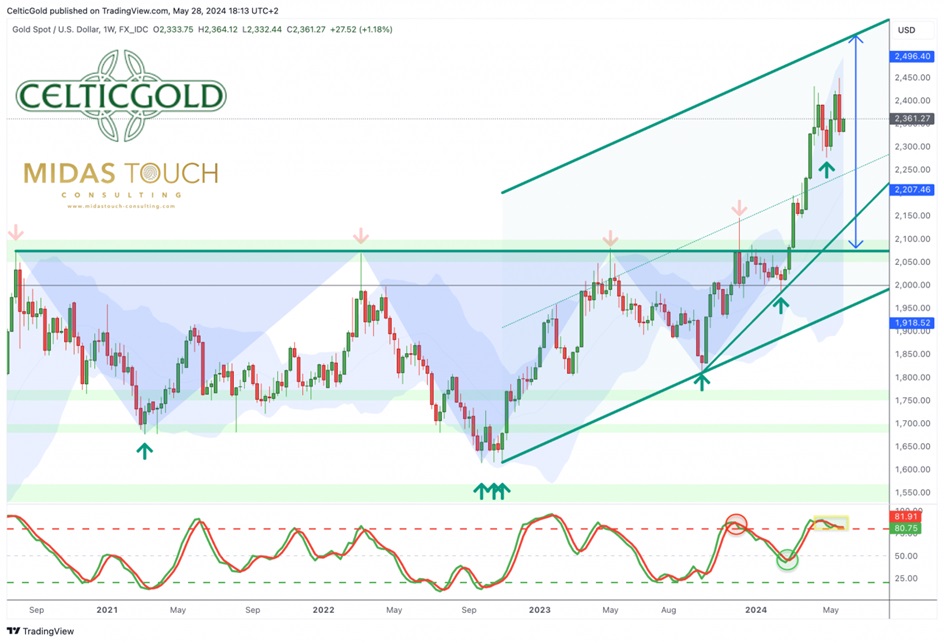
Gold in US-Dollar, weekly chart as of May 28th, 2024. Source: Tradingview
On the weekly chart, the gold price is moving within the upper part of the upward trend channel that began in October 2022. The successful breakout above the resistance zone around USD 2,075 and the accompanying resolution of the inverse head and shoulders formation still suggest an initial price target in the region of USD 2,535. Theoretically, this could be achieved within the coming weeks within the upward trend channel. The upper Bollinger Band already allows for prices up to USD 2,495.
Additionally, the stochastic oscillator, which remains bullishly embedded, still has the uptrend locked in and could push prices higher. However, another weak trading week would probably result in a sell signal here.
The price action over the last six weeks, however, is not particularly convincing. Gold lacks momentum and breakout power. The new all-time high of USD 2,450 was just USD 20 above the April 12th high of USD 2,431. Nonetheless, the upward trend remains intact and would only be seriously threatened at prices below USD 2,275.
Overall, the weekly chart is still bullish. If the weekly stochastic can stay above 80 with both signal lines, the rally is likely to continue. But again, it doesn’t take too much from the bears to flip this chart.
Daily chart: Stochastic sell signal about to reach oversold levels soon
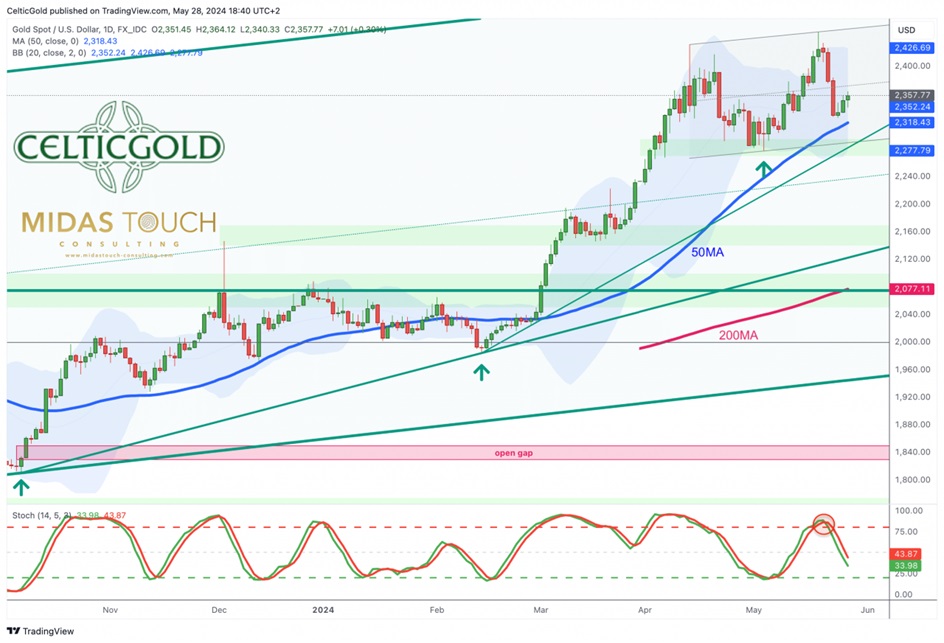
Gold in US-Dollar, daily chart as of May 28th, 2024. Source: Tradingview
On the daily chart, the breakout from the flag consolidation provided the next push upwards. However, the rally starting from USD 2,277 has expended a lot of energy, and the new all-time high is not very impressive so far.
The overbought stochastic oscillator failed to transform into the super bullish embedded state last Wednesday and instead activated a new sell signal during last week’s sell-off. Consequently, reversal signals have increased significantly. With an initial pullback towards USD 2,328 gold has already reduced ist wide gap to the 50-day moving average (USD 2,318). Yet, the 200-day moving average (USD 2,077) is still far away. This gap will need to be corrected either through lower prices or through sideways price action over time.
In summary, the daily chart is slightly bearish. The risk of a double top at USD 2,431 and USD 2,450 cannot be ignored. The significant distance to the 200-day moving average (USD 2,077) still suggests a substantial need for correction. The fate of the rally is likely to be decided at the support zone between USD 2,280 and USD 2,300 in the coming weeks.
Commitments of Traders for Gold – Bearish
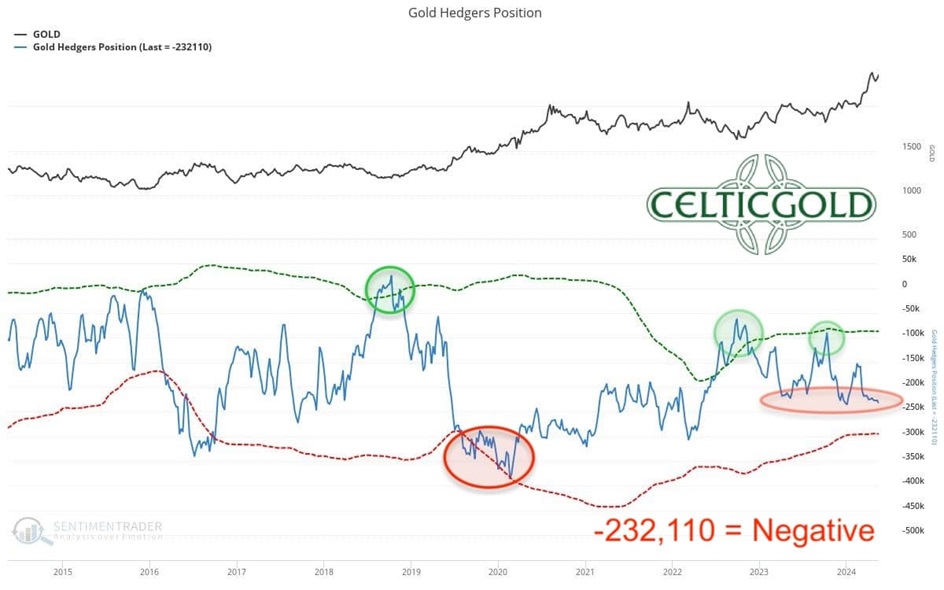
Commitments of Traders (COT) for gold as of May 14th, 2024. Source: Sentimentrader
As of the closing price of USD 2,358 on May 14th, commercial traders held a cumulative short position of 232,110 gold futures contracts. It is evident that the professionals and bullion banks are finding it difficult to significantly expand their short positions despite the notable price increase over the past few months. Nonetheless, the net result remains a clearly bearish positioning.

Overall, the current CoT report is negative and opposes rising prices. Given that the gold price is now largely influenced by the market in China, we assign significantly less importance to the CoT report than we did a few years ago though.
Sentiment for Gold – Too optimistic
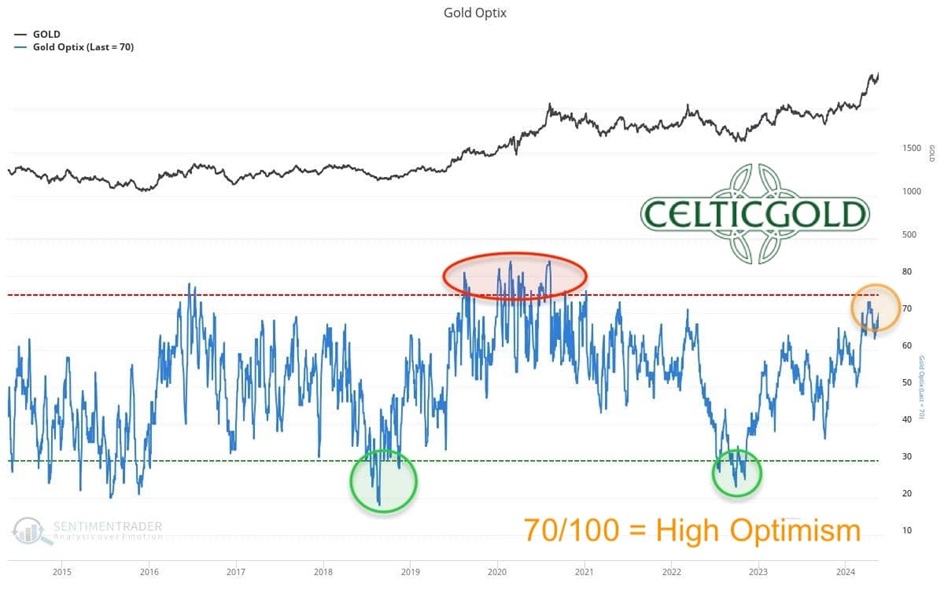
Sentiment Optix for gold as of May 22nd, 2024. Source: Sentimentrader
Although gold has risen significantly by over USD 640 since early October 2023, the Sentiment Optix, with a value of 70, has not yet indicated extreme optimism. The market still lacks euphoric excess. From this perspective, the gold market rally could therefore continue either directly or through indirect means.
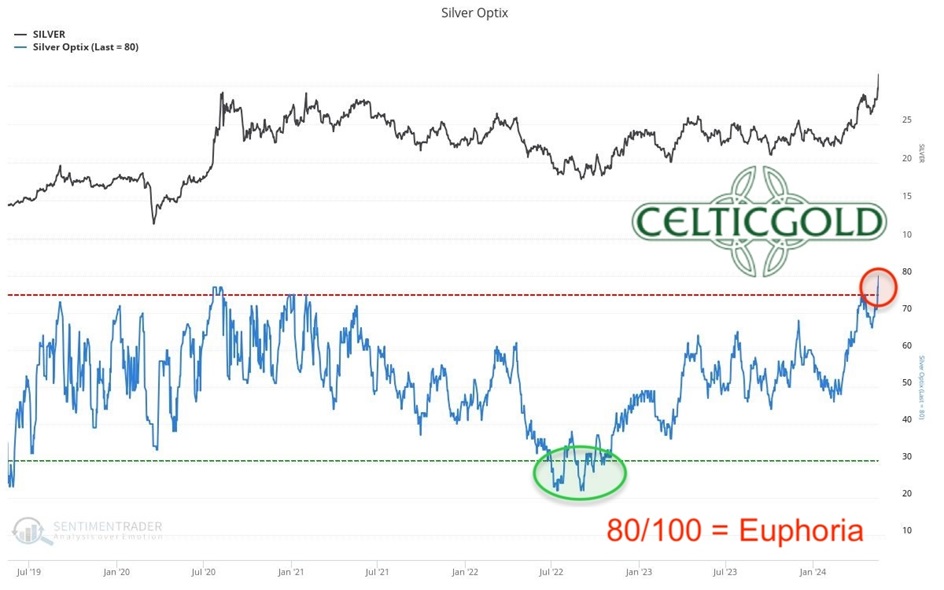
Sentiment Optix for silver as of May 18th, 2024. Source: Sentimentrader
In contrast, the silver market has recently exhibited extreme euphoria levels, warranting heightened vigilance for contrarian investors.
In summary, sentiment in the gold market is too optimistic. However, there is still no sign of an overly exaggerated euphoria.
Seasonality for Gold – Negative
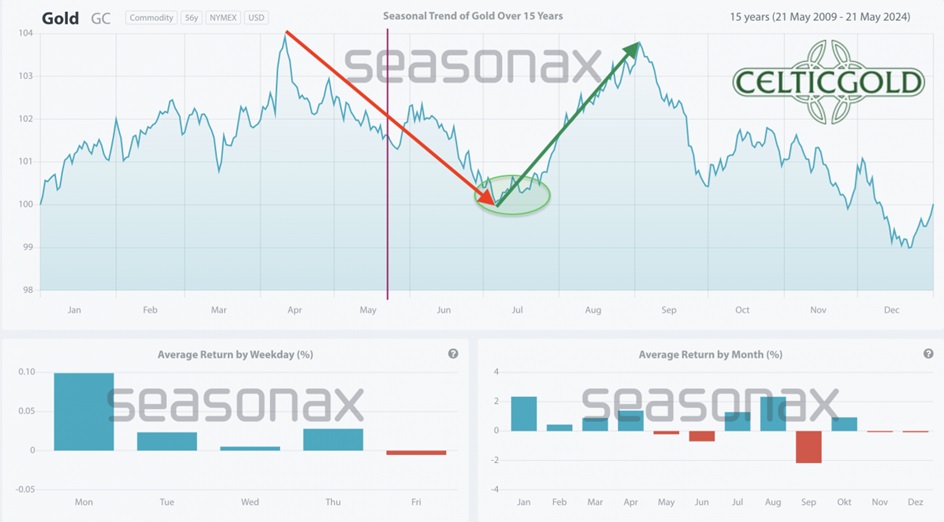
Seasonality for gold over the last 15-years as of May 22nd, 2024. Source: Sentimentrader
Statistically, the favorable seasonal period for the gold price ended in mid-April. Nevertheless, a slightly higher peak was achieved in mid-May. Recently, reversal signals have been accumulating in the gold market. Whether the unfavorable seasonal component will assert itself this year remains to be seen.
In general, rallies in the gold market typically peak between late February and mid-May and then undergo a healthy correction into the summer. This year, strong demand from China, coupled with the unstable geopolitical situation, might alter this pattern. Nonetheless, the seasonal aspect should not be underestimated.
Based on the last 15 years, the seasonal component for the next two months is negative.
Macro update – The Crack-Up-Boom might need to let off some steam before continuing.
Although gold and silver prices have dropped significantly in the last week, both precious metals continue to trade at a substantial premium on the Shanghai Stock Exchange in China. Hence, gold has quickly recovered some of those losses from last week. However, the Shanghai Futures Exchange recently increased the margin requirements for silver. Similarly, the CME in the USA raised the maintenance margin for silver futures by 9.5% effective as of May 23rd.
Historically, we know that margin increases often signal the end of a rally in precious metals. In May 2011, it took five margin hikes within nine days to halt the steep rally in silver prices and trigger a wave of liquidations. Despite the strong rally in silver prices in recent weeks, the current situation is certainly not as tense. For copper futures, which have surged recently, the CME has already increased margins three times in the last two weeks.
Will Chinese demand for gold absorb the recent downturn?
The big question now is whether the Chinese demand for gold will once again absorb the recent downturn in precious metal prices early. Although expectations for the US interest rate at the end of 2024 have risen by more than 100 basis points since the beginning of the year, gold has remained unaffected so far. Additionally, the net outflows from gold ETFs have not exerted increasing pressure on prices. Instead, the gold and silver rally since October has been primarily driven by central bank purchases and very robust physical demand from India and China. Western financial market participants, however, are still bewildered by the significantly rising gold price. The well-known suppression mechanism through derivatives and futures has rarely worked at COMEX in recent months. Furthermore, the precious metal rally has not yet reached mainstream media.
Geopolitical tensions remain a crucial factor for gold
The escalating geopolitical situation remains a crucial factor. Due to sanctions, Russia now conducts almost all its trade with China in Renminbi and Rubles. A similar situation is emerging in a growing part of Africa. Meanwhile, the West failed in an attempted coup in the Congo last week, presumably to secure important resources there.
Overall, significant tension is brewing for NATO and the West. China is currently conducting a large-scale military maneuver, as the Chinese military has apparently started exercises around Taiwan, including the Kinmen and Dongyin islands. The Taiwanese Coast Guard and the Chinese Navy are currently facing each other directly in the Taiwan Strait, with Taiwanese Hsiung Feng III (HF-3) supersonic anti-ship missiles deployed in response to Chinese exercises around Taiwan. It wouldn’t take much for this situation to ignite.
The second hotspot remains in Ukraine. The Russian advance is nearly unstoppable due to Ukraine’s lack of personnel reinforcements and Europe’s lack of strong leadership and sustainable unity on how to effectively assist Ukraine.
The mysterious death of Iranian President Ebrahim Raisi in a helicopter crash could also lead to further geopolitical upheavals, especially in connection with the conflict in the Gaza Strip.
Given these factors, it is reasonable to assume that precious metal prices are overall well-supported, and that new demand could emerge at slightly lower prices.
Conclusion: Gold – Reversal signals are increasing
Since October 6th, 2023, gold prices have significantly increased from USD 1,810 to USD 2,450. Although the rally was not a one-way street and was repeatedly interrupted by pullbacks and consolidations, the overall result is an impressive price increase of +35.3%.
In the same period, silver prices by 57.2%, with the rally gaining real momentum only from the end of February. Particularly from early May, the silver bulls took the lead, driving the price above the strong resistance zone around USD 30 in the past three weeks. However, since this breakout occurred late in this upward cycle, caution is now warranted. Typically, silver exhibits such behavior at the end of a major upward movement in the precious metals sector, almost always signaling a coming trend reversal and a correction.
Last week’s price action already suggests that an important interim high might have been reached on Monday 20th of May in the gold market. While gold prices, in particular, lack the vertical euphoric overshoot as a grand finale, it can equally be argued that gold bulls only managed a tired and small step further with the latest new all-time high of USD 2,450 being a mere USD 20 above the one from mid-April.
Potential head-and-shoulder topping pattern in the gold market
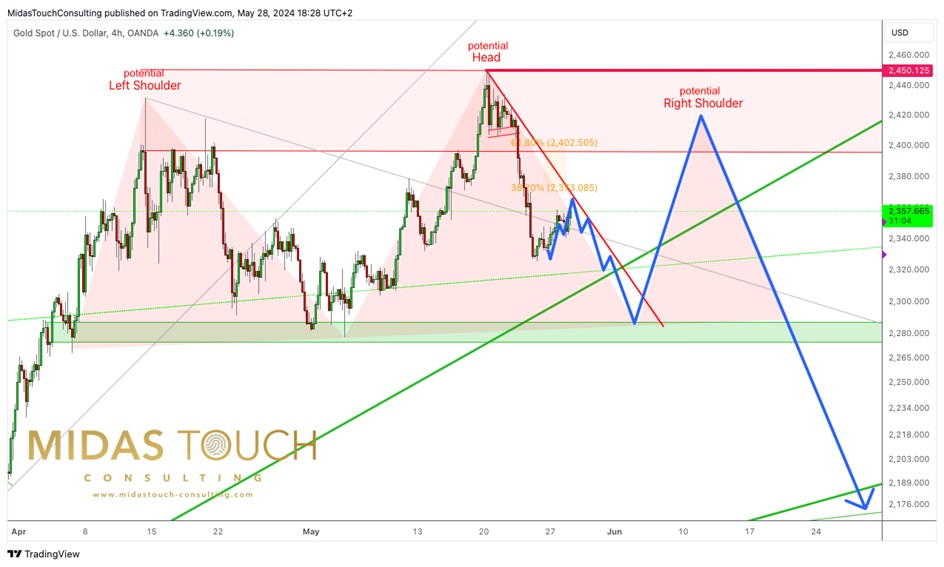
Gold in US-Dollar, daily chart as of May 28th, 2024. Source: Tradingview
Given the unfavorable seasonal components, we prefer not to make any bold predictions at this moment and will wait to see what the next few days might bring for the gold market.
One potential scenario we could imagine at this point is a head-and-should-topping pattern for the gold price over the coming weeks. This would result in one more push towards and above USD 2,400 while the support around USD 2,280 to 2,300 would need to hold initially. Once the left shoulder has been done, gold may then start its correction back down towards the breakout zone between USD 2,075 and 2,150. The pattern would point to approximately USD 2,110 as a potential target! However, this is just one scenario we have in mind. As long as gold can hold above USD 2,275, overall the bulls are in charge!
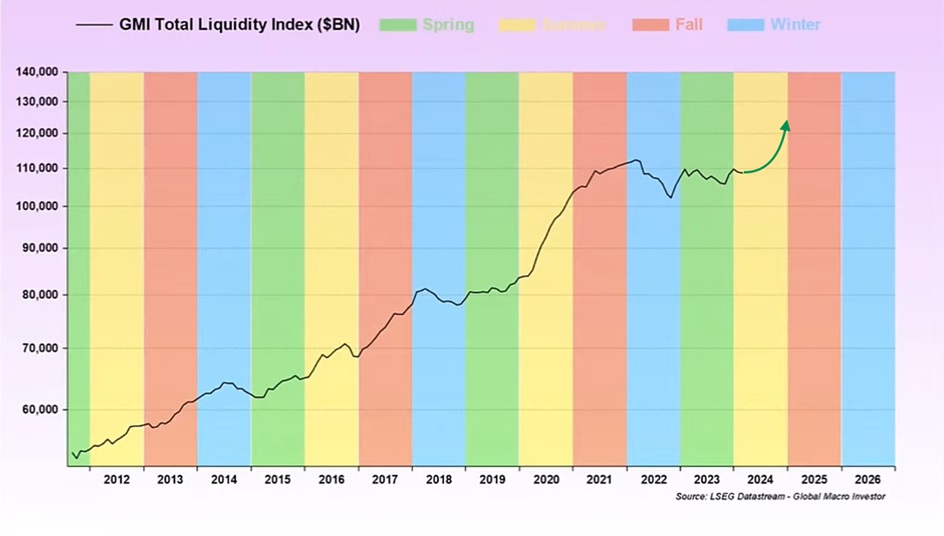
GMI Total Liquidity Index, as of May 14th, 2024. Source: Global Macro Investor
In the larger picture, financial markets should continue to move upwards in a crack-up boom. We communicated this clearly and distinctly almost four years ago, and despite the occasional extreme fluctuations and high volatility, nothing has changed in this regard. However, similar to a pressure cooker, the hot air or pressure occasionally needs to be released. This could begin in the next few weeks and months during the weaker summer period with profit-taking, which could then lead to a somewhat more painful pullback, especially for the very well-performing tech stocks and Bitcoin, but naturally also for precious metals.
“Gold – Reversal signals are increasing” – analysis was initially published on May 23rd, 2024, by www.celticgold.de and translated into English as well as partially updated on May 29h, 2024.
Feel free to join us in our free Telegram channel for daily real time data and a great community. If you like to get regular updates on our gold model, precious metals and cryptocurrencies you can subscribe to our free newsletter.
Disclosure:
This article and the content are for informational purposes only and do not contain investment advice or recommendations. Every investment and trading move involves risk, and readers should conduct their own research when making a decision. The views, thoughts and opinions expressed here are the author’s alone. They do not necessarily reflect or represent the views and opinions of Midas Touch Consulting.
*******
share
share
share
share
share
 Florian Grummes (born 1975 in Munich) has been studying and trading the Gold market since 2003. In 2008 he started publishing a bi-weekly extensive gold analysis containing technical chart analysis as well as fundamental and sentiment analysis. Parallel to his trading business he is also a very creative & successful composer, songwriter and music producer. You can reach Florian at: [email protected].


