Gold Forecast: Gold at Risk to Larger Decline


 With the most recent action, Gold has seen a spike back to higher highs into last week, with the metal running up to a Friday peak of 3071.90 (June, 2025 contract). With that, a key top is forming in the metal, one that should give way to a sharp decline in the coming weeks/months.
Gold's Short-Term View
For the very short-term, the next smaller-degree peak is expected to come from the 10-day cycle in Gold, which is in topping range - and is shown on the chart below:
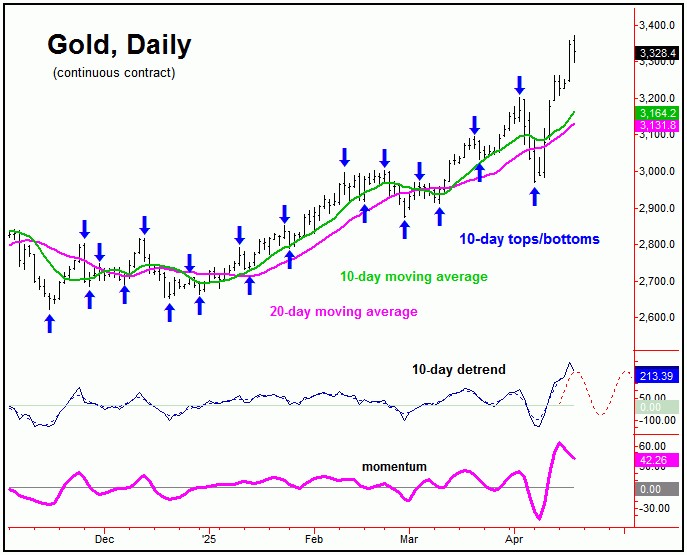
In terms of time, there has been a focus on the April 16-17 timeframe for this cycle to peak, which is our most current short-term turn date. Once this 10-day wave tops - which has some potential to have already formed - a quick correction back to the 10-day moving average would be the minimum expectation.
The 34-Day Cycle in Gold
Stepping back slightly, the last low for our larger 34-day cycle was the 2970.40 figure, which dropped back to our 34-day moving average magnet, though which bottomed earlier than normal time assumptions.
Here is that 34-day wave:
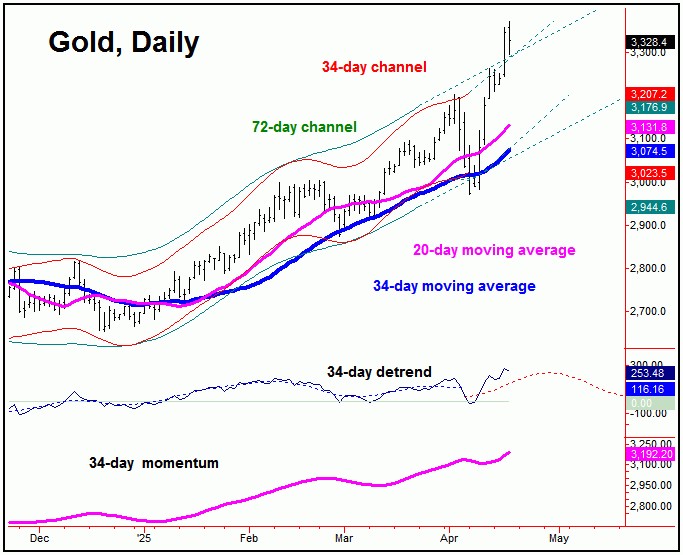
With the recent action, Gold has spiked above the extrapolated upper 34 and 72-day cycle channels, and with that warns of a more significant peak forming. With that, the current upward phase of this 34-day cycle should top, at minimum, the larger 72-day component, for what is expected to be a sharp correction to follow.
In terms of price, once the next correction phase of our 34-day cycle is in force, the 34-day moving average should again act as the normal minimum magnet - which is nearly 200 points below current price levels.
Having said that, due to the position of our larger 72-day wave, there is the decent potential for a decline on down to the lower 72-day moving average. This 72-day cycle is shown on the chart below:
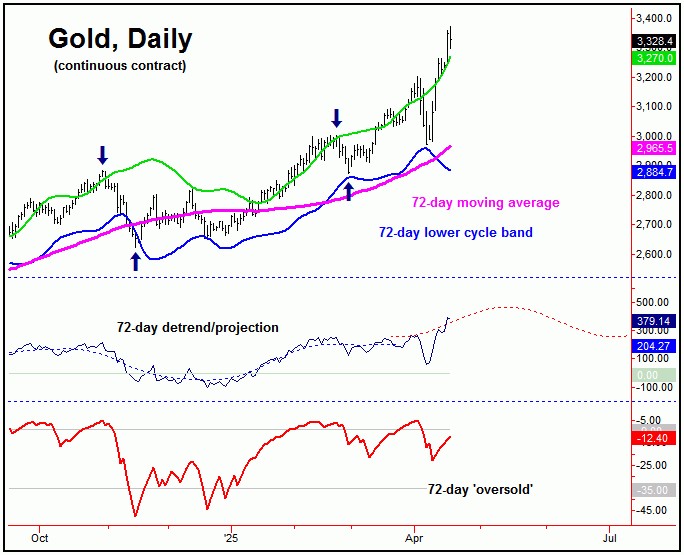
As shown above, the 72-day moving average is over 300 points below current price levels, and could/should act as the magnet to the coming correction phase of this wave. In terms of time, this cycle is next projected to trough around June of this year, plus or minus.
The Mid-Term View
Due to the extended position of our larger 310-day component, there is the potential for a larger-degree decline to play out into late-Spring (May/June).
Here again is that 310-day wave in the Gold market:
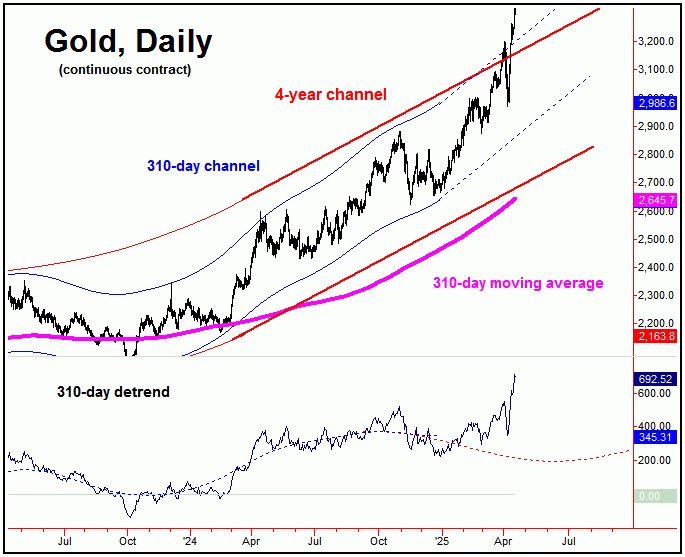
As with our 34-day chart, the rise in Gold prices has seen the metal spiking above its upper 310-day and four-year cycle channels. With that, there is the potential for the extended upward phase of this 310-day wave to be topping, though is too early to confirm.
Lastly this weekend, our Gold Timing Index is showing a divergence against the new price high, seen as a larger technical negative:
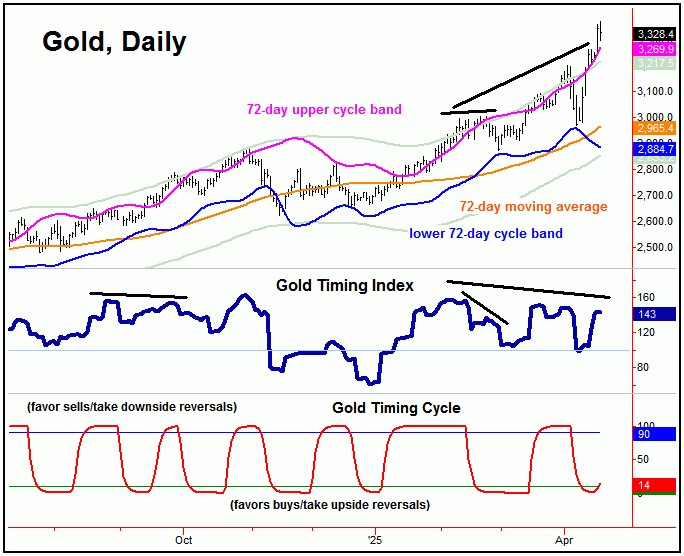
The divergence in our Gold Wave Trader is bearish, and supports the idea of at least a short-term correction playing out (i.e., 10-day cycle). However, this indicator also supports a larger peak forming, such with our 72-day wave - if not something even bigger.
The best decline phases always come from divergences in this indicator, with the last such divergence seeing a drop of over 230 points with the metal - and which ended up as our last 34-day cycle trough. We'll see what transpires in the coming days, with the current position of the cycles - and with the technical negatives currently forming.
Jim Curry
The Gold Wave Trader
Market Turns Advisory
http://goldwavetrader.com/
http://cyclewave.homestead.com/
********


