Gold, Silver and Crypt: How Charts Look Before A Dollar Meltdown
 share
share
 share
share
 share
share
 share
share
 share
share
The US dollar is on the brink of a major meltdown. This is apparent based on fundamental and technical analysis. Over the last 5 years, the US dollar has sustained some major damage through policy without losing much value against other fiat currencies.
In other words, the market has not yet taken into account the true (debased) state of the US dollar, but it will soon. Since the US dollar is probably the most significant currency in the world, its meltdown will be devastating for many.
Therefore, it is imperative to find a safe haven during a US dollar meltdown. This is a monetary crisis and should preferably be addressed with monetary alternatives. Gold and silver are the premier monetary assets, so they should be an obvious choice.

Bitcoin and crypto currencies—love them or hate them—are, in themselves, a major sign of monetary meltdown. I have previously written about this, and how it relates to the low velocity of money now and during the Great Depression. These will also likely provide (temporary) protection against the effects of a US dollar meltdown.
The charts for these safe havens are really bullish and warn of a major US dollar meltdown.
Gold
Below is a gold chart I shared previously:
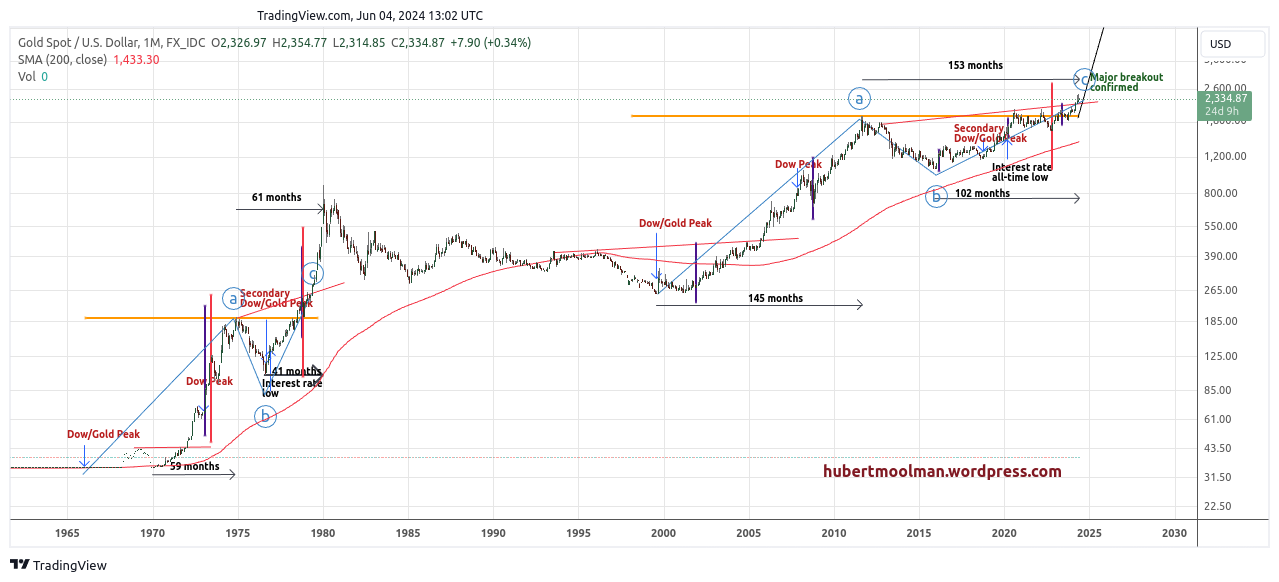
I’ve marked out two patterns showing how the recent breakout puts gold in the acceleration phase of the bull market. Both patterns start at the Dow/Gold ratio peak (1966 and 1999, respectively). After the Dow/Gold ratio peaks, gold went on a strong bull run, which continued even after the 1973 and 2007 Dow peaks, respectively.
After the peaks at point a, the chart formed a cup-type pattern. During this consolidation (the cup), there was a secondary Dow/Gold peak, and interest rates also reached an important low. The structure of the 70s pattern was such that after the bottom (point b) during the cup phase, the price moved relatively slowly up at first, but once it broke out at the red line, it moved up quite fast.
The current pattern may be following the same progression. The move since the bottom of the cup phase (point b) has been slow, but now that the price has finally broken out at the red line, we may see an accelerated increase in price (of course, we are probably seeing some sort of retest or consolidation before the accelerated move higher).
Silver
Below is a silver chart previously shared:
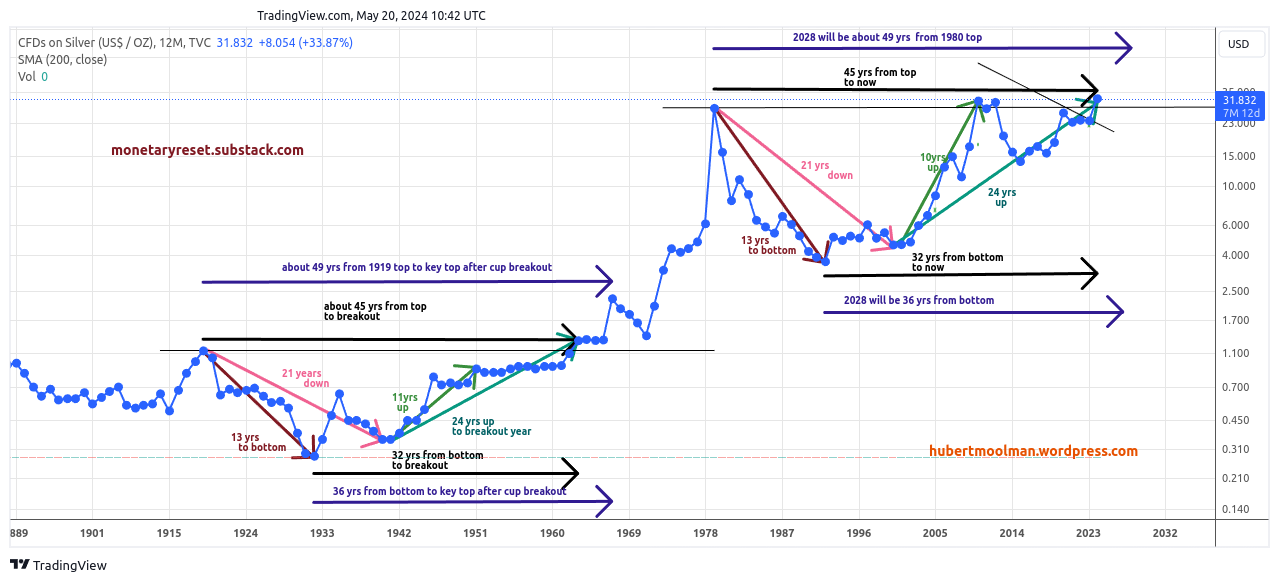
The 49-year pattern from 1919 to 1968 has a similar form to the one that started circa 1980. Here, I have pointed out their similarity as it relates to time. There may be rounding differences due to the yearly closing balances.
The first cup started at the 1919 peak, and it took about 13 years to get to the bottom (1932), whereas it took about 21 years to get to the secondary bottom in 1940. In a similar manner, the second cup started at the 1980 peak, and it also took about 13 years to get to the 1992 bottom and about 21 years to get to the secondary bottom in 2000.
It took about 24 years from the secondary bottom in 1940 to the break out of the cup in 1963. About 24 years have passed since the secondary bottom in 2000. So, this year is likely the breakout year, provided the pattern stays true to the original one.
Bitcoin
Below is a long-term chart of Bitcoin:
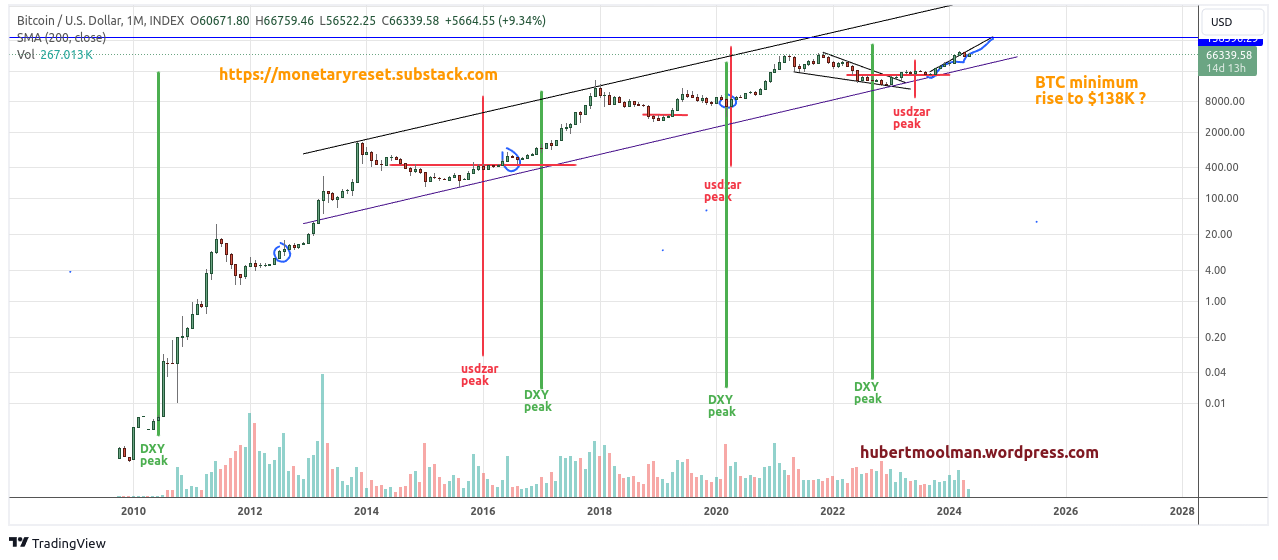
Bitcoin consistently rallies after important DXY (dollar index) peaks. This time will be no different. The minimum target for this rally is around $138k. The alts (other major crypto currencies) are more likely to outperform Bitcoin during this rally.
I also have a Premium Service as well as a Silver Long-term Fractal Analysis Report that provides more insight regarding the gold and silver markets. Subscribe to Telegram Channel: https://t.me/hgmsilvergold
**********
share
share
share
share
share