Gold Is Stepping Up Its Monetary Dominance


The gold chart appears to be going parabolic, based on a solid structure that has been setting up since the 1800s. This structure is also related to the key U.S. monetary debasement events that affected the U.S. dollar since that time.
Here is a long-term gold chart:
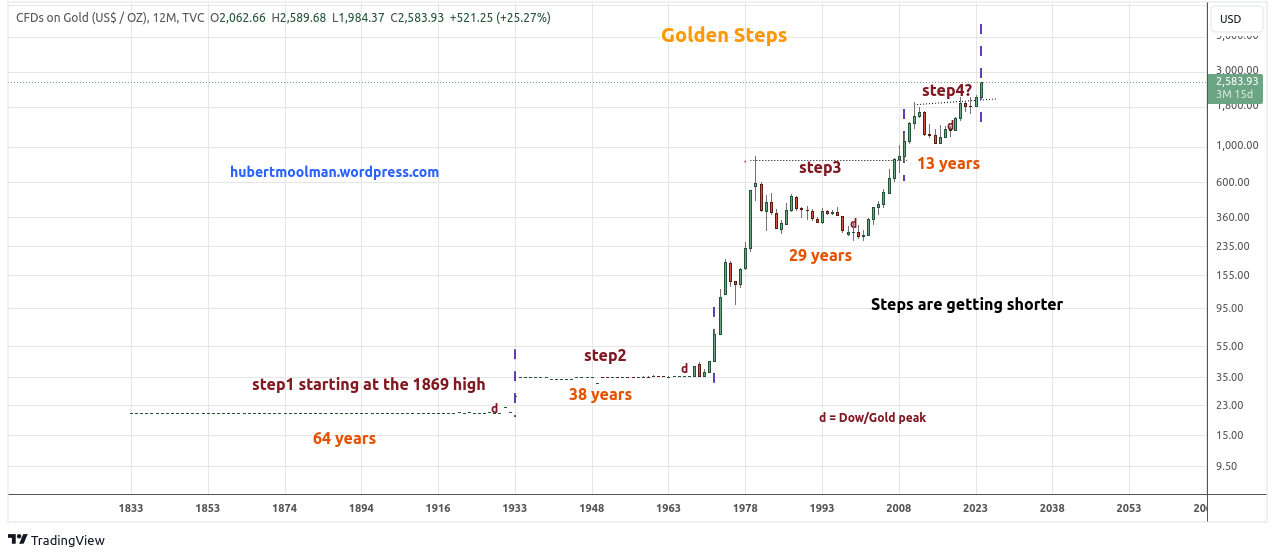
The U.S. dollar gold chart has a series of “steps” that go back to the 1800s. These represent periods of consolidation after significant gold highs. These periods of consolidation for the gold price could be described as stability for the fiat world. Each step ended shortly after a significant Dow/gold ratio peak (marked with d) approximately where the dashed lines are drawn.
At the end of the steps around 1933, 1971, and 2008, significant events (or changes) that impacted the financial system (the U.S. dollar) occurred. Since 1933, the paper U.S. dollar went from constituting a promise to pay an amount of silver or gold to now being a promise to pay nothing.
At the end of step 1 (1933), the dollar was devalued and made non-convertible to gold domestically.
At the end of step 2 (1971), the dollar was made non-convertible (or non-backed) to gold for foreign nations and allowed to find its price level (free floating exchange rates with no fixed gold price).
At the end of step 3 (2008), the quantity of dollars was increased by an unprecedented level. The monetary base went from 847 billion dollars in August 2008 to 1 710 billion in January 2009. In other words, in those 6 months from August 2008, more dollars were created than during the entire history of the Federal Reserve dollar from 1913 to August 2008.
Step 4 ended this year, around March. Gold is seeking a new level just like it did for the previous steps. What significant event or change in the nature of the U.S. dollar might occur with this change in step? It appears the market is pricing in a significant decision that has been (or will be) taken among key nations. This year’s BRICS summit might have something to do with it. The Dollar’s next significant change might now be out of the control of America contrary to all previous changes described above.
The risk of U.S. dollar demise is also evident in the U.S. Dollar Index (DXY), as shown here.
From a charting point of view, these steps are getting shorter and shorter, from the earliest one being 64 years to the latest one being only 13 years long. This is typical behaviour for a chart that is in the process of going parabolic. This also warns of much more volatile economic conditions compared to the stability enjoyed by previous generations.
Gold and silver are at the beginning of a multi-year rally and will likely go higher much faster than ever since the creation of the Federal Reserve dollar.
Keep up with this bull market by joining my premium blog.
Warm regards
Hubert Moolman
And that, knowing the time, that now it is high time to awake out of sleep: for now is our salvation nearer than when we believed.

*******


