Gold Stocks are Breaking Down
Attention: As an analyst and a trader, my job is to analyse and trade. But I have learned to differentiate between the two. I trade on my signals and set ups, not my analysis. Analysis provides the road map so we know where we are going. Signals and set ups are the traffic lights, we must obey them in order to navigate safely. Knowing the average trader having trouble donning on two hats, I will make every effort to separate my analysis from my signals in all of my commentary going forward.
The analysis

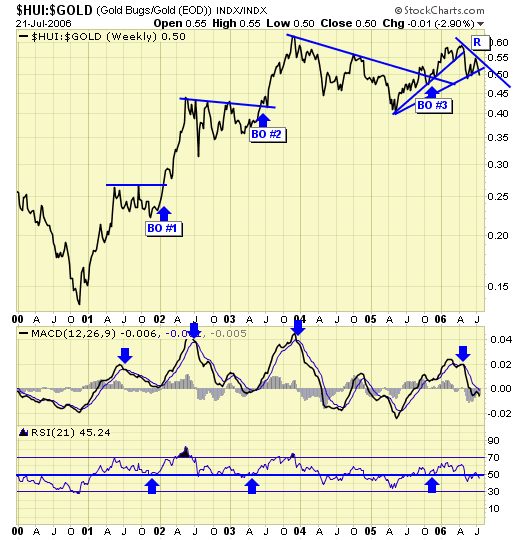
Ever since the $HUI made a new high at 400 in May, I have been warning about the bearish divergence, which unless /until it is corrected, will have negative impact for gold stocks.

My breakout model broke down in May, and again this week, and in the process, established a down trend resistance. Traders should be short or in cash until this resistance is violated.

The head & shoulder topping pattern from my last commentary has now completed the right shoulder. A break of the neckline and the downside target for the $XAU is 100.

220 for the $HUI.

$28 for the GDX.

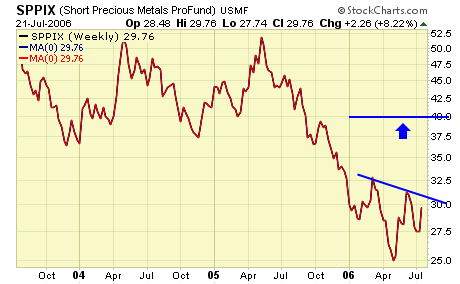
Conversely, an upside target for the SPPIX would be $40.00
The signal

SPPIX - we had a buy signal on 7/20 and bought this bear fund at $29.76, and we shall exit this trade on a violation of support currently at $28.40 and rising. The risk is 4.5% and with the upside target at $40 which is 30%, odds are very favorable.
Summary
There you have it.
* The analysis suggests lower prices ahead for gold stocks.
* Our trading model gave us a buy signal on the bear fund.
* Risk is acceptable and manageable.
* We pull the trigger.
My job as an analyst is done. My job as a trader is also done. We shall now leave it in the hands of the market Gods, and accept whatever the outcome is. Time to go fishing.
********


