Gold Stodgy; Stocks Dodgy


Per our prior missive on Gold having recorded its second-narrowest trading week of 2024 (by percentage distance between high and low), now this last week’s performance perhaps is best categorized as “stodgy”, which by the Oxford English Dictionary (for you WestPalmBeachers down there) in part is defined as “lacking in spirit or liveliness.” To wit, by entering this past trading week with an EWTR (“expected weekly trading range”) of 81 points, Gold’s actual range from low-to-high was just 70% of that at 57 points, price settling yesterday (Friday) at 2527, despite all the “Fed” this, and “Jobs” that, and stocks’ “Worst Week” in a year, suddenly replete with FinMedia fear.
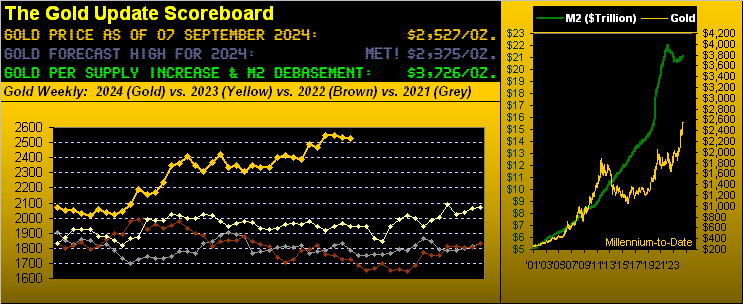
In turn, that 2527 price level is (for those of you scoring at home) -32% below Gold’s Dollar debasement valuation of 3726 as above depicted in the upper panel of the Gold Scoreboard. Yes, we regularly harp upon such undervaluation if for no other reason than Gold historically catches up to its supply-adjusted debasement value (i.e. per the Dollar’s green “M2” money supply line) as shown in the Scoreboard’s righthand panel. Do not lose sight of that fact, lest you end up in the vast “woudda shoudda coudda” crowd who are without Gold once it justifiably really takes hold.
Still, stodgy as it seems, our broader graphic of Gold’s weekly bars from one year ago-to-date remains robust and cheerful. Here ’tis:

“Robust” indeed, given Gold’s firmly rising regression trendline. “Cheerful” to be sure, as the last three red-dotted parabolic Short trends have been but three weeks apiece. Thus “stodgy” as it may presently be (at the risk of using a “woke” adjective), “awareness” of Gold seems to be picking up, albeit we regularly read that almost nobody owns it. Still, when ’tis time for “Old Yeller” to pay that looming U.S. debt bill, shall the Federal Reserve have to again turn the crank on the money mill? Mind that Dollar Index as ’tis looking a bit ill, (your personally mitigating such by taking the Gold pill):
‘Course, the Buck’s upside pluck into September 2022 per the above weekly chart clearly came in tandem with the Fed raising its Funds Rate. But now that the Open Market Committee per its 18 September Policy Statement shall initially reduce said rate by -0.250%, the bang for the Buck is starting to wane. Yes, the nattering nabobs of Gold negativism love to swiftly point out that the yellow metal offers no yield. But given Gold’s aforementioned undervaluation of -32%, that “catch-up yield” by price alone looks excellent to us.
Meanwhile “catching-down” (if you will) is the “dodgy” stock market. ‘Tis always entertaining to read the FinMedia freak-out whenever the market puts in even just a pimple of a correction. “S&P 500 tumbles Friday to post worst week since 2023” trembles CNBS, (our being more precise, since that ending 11 March 2023). True, the S&P’s net loss for the past week was -4.2%. But let’s put that in context:
- from the year 2000-to-date — through the DotComBomb, FinCrisis, and CrazyCovid — this past week’s net loss for the S&P 500 was its 54th worst across those 1,288 weeks. “Oh dear!”
Hardly ho-hum, but the fear elicited through the FinMedia was both formidable and (for us) fun. And it shows just how complacent have become the “youngsters” of modern-day Wall Street. Let’s again reprise BTO from ’74 with “You Ain’t Seen Nothing Yet”
“Well, it is September, mmb…”
So ’tis, Squire, and yes, across the 54 years from 1970 through 2023, by average net monthly percentage change, September does rank as the year’s worst month for the S&P 500, followed by February; the best two months are April (surprise!) and November. (The once highly-vaunted month for the “January effect” ranks fourth-best of the 12 all told).
But in support of Squire’s point, September is the notorious month of so-called tax-loss selling season and fiscal year-end for many a mutual fund.
Yet today, the S&P 500 more broadly refuses to be severely shaken. The ongoing “out-of-sight, out-of-mind” level of our “live” S&P 500 price/earnings ratio eternally living in the 30s and 40s remains inanely uncanny. Again remindful of one J. B. Cohen: “…in bull markets the average [P/E] level would be about 15 to 18 times earnings.” However: that for the summation of the 503 S&P constituents settled yesterday at 38.2x (price ÷ trailing twelve-month earnings x market cap weighting, with earning-less stocks ascribed a P/E of their stock price).
‘Course the culprit supporting it all is the $7T COVID monetary injection essentially (as we’ve mathematically proven) having ended up in the stock market. And ’tis still there, refusing to go anywhere: thus the bubble. Risk-free debt is boring and doesn’t work well in showing off at cocktail parties. As for all those talking marked-to-market millionaires … one day they’ll morph into head-hanging thousandaires. ‘Tis only fair … but beware: the next P/E means reversion shan’t be a happy excursion.
However, fairing a bit better of late is the Economic Barometer. In just the past holiday-shortened StateSide week, of the 13 incoming metrics for the Econ Baro, nine improved period-over-period, the notable standouts being July’s Factory Orders, Q2’s revision to Productivity, and for August both Hourly Earnings and The Institute of Supply Management’s Services Index.
Noted however, was the really rotten ADP read on August’s Employment: for the past post-COVID 36 months, the average monthly jobs gain had been 278,000; this time ’round the number was just 99,000, some -34% below consensus, not to mention the July reading being revised lower as well. But “Labor’s” number (dare we say “of course”) improved, as on balance did the Baro:
So does all such stalwart economic improvement ward off recession? From the “Dept. of Say It Ain’t So, Joe” we’ve this (hat-tip Dow Jones Newswires): “The bond market just flashed a reliable recession signal.” Glad to see them just now figuring this out. The Econ Baro’s been portraying such for the past half year … (but as you know, it leads everything else). “Fuses as usual in the white security box.” –The RAF’s unnamed Air Vice Marshal, “Thunderball”, ’65]
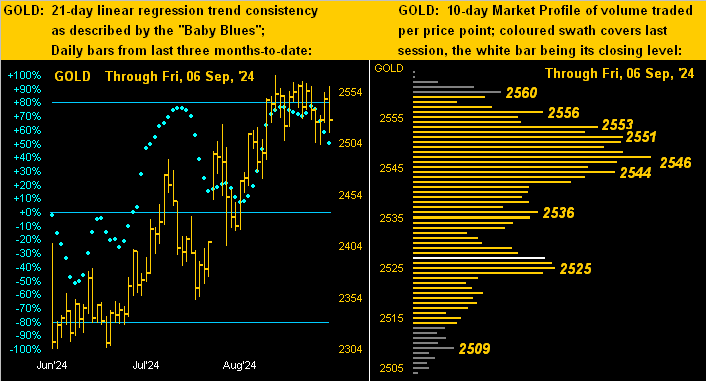
Still, anything but thundering is stodgy old Gold. In below viewing our two-panel graphic, on the left with price’s daily bars from three months ago-to-date we’ve Gold’s baby blue dots of trend consistency dropping off, not even have achieved the key +80% axis, whilst on the right in the 10-day Market Profile, the 2540-2560 zone shows as overhead volume resistance. As noted in recent missives, our forecast high for the year of Gold 2375 we now view as mid-structural price support:
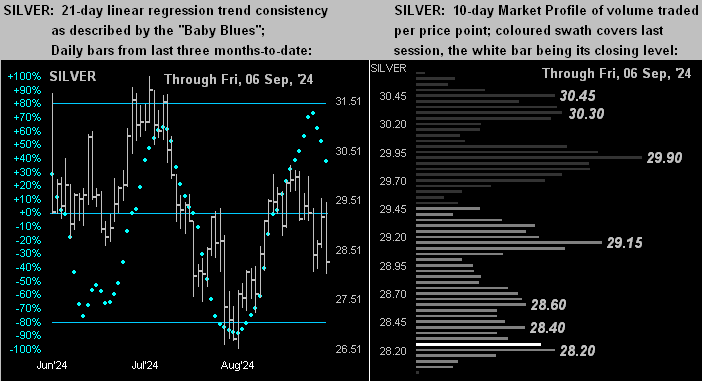
Silver’s drill is similar, albeit with a weaker bent. Like those for Gold, Silver’s “Baby Blues” (below left) are falling, whilst her Profile (below right) depicts major volume resistors at 29.15, 29.90 and then the 30.30-30.45 zone. And with the Gold/Silver ratio now back up to nearly 90x (presently 89.4x), what can one say other than “Poor ol’ Sister Silver!”
Let’s call it a week here with this monetary anomoly.
We earlier mentioned the stock market’s buoyancy given the presto-chango $7T post-COVID money supply injection, indeed there being so much dough sloshing to and fro that — save for stocks — there’s ostensibly no where else for it to go in this Investing Age of Stoopid à go-go. But then, too, is the stark reality of S&P 500’s market cap having settled yesterday at $47.3T supported by a liquid StateSide money supply (M2) of “only” $21.1T, i.e. not nearly enough dough! Whoa! And yet, you’d love to see your kid become a Wall Street pro? Oh pity the poor floor specialist, don’t you know…
Better instead, buddy-boy, go buy some Gold!
Cheers!
…m…
www.TheGoldUpdate.com www.deMeadville.com and now on “X”: @deMeadvillePro
*********

Mark Mead Baillie has had an extensive business career beginning in banking and financial services for two years with Banque Nationale de Paris to corporate research for three years at Barclays Bank and then for six years as an analyst and corporate lender with Société Générale.
For the last 22 years he has expanded his financial expertise by creating his own financial services company, de Meadville International, which comprehensively follows his BEGOS complex of markets (Bond/Euro/Gold/Oil/S&P) and the trading of the futures therein. He is recognized within the financial community of demonstrating creative technical skills that surpass industry standards toward making highly informed market assessments and his work is featured in Merrill Lynch Wealth Management client presentations. He has adapted such skills into becoming the popular author each week of the prolific “The Gold Update” and is known in the financial website community as “mmb” and “deMeadville”.
Mr. Baillie holds a BS in Business from the University of Southern California and an MBA in Finance from Golden Gate University.