Gold Supply Falling Short Of Demand
 share
share
 share
share
 share
share
 share
share
 share
share
It’s been a volatile week in the markets.
On Monday, Aug. 5, the Dow Jones Industrial Average lost more than 1,000 points, and the S&P 500 dropped 3%, resulting in the worst day for both indexes since September 2022.
The sell-off was blamed on factors ranging from worries about the economy and the slow response from the Federal Reserve, regarding interest rate cuts, to the unwind of a popular global currency trade and concerns over corporate earnings, CNBC said.
(The “carry trade” involves borrowing in cheap currencies such as the Japanese yen and buying higher-yielding currencies. It has helped to supply markets with liquidity.)
“It’s just a perfect storm of slowing growth, crowded positioning and risk-off sentiment that’s all coming to a head at the same time,” said John Belton, portfolio manager at Gabelli Funds.

Ugly data sets on manufacturing and layoffs last week were behind the economic concerns. The Labor Department reported lower-than-expected job creation numbers and a rising unemployment rate in July that triggered a reliable recession indicator known as the “Sahm Rule”.
Traders began pricing in aggressive rate cuts, even sooner than the expected quarter-point reduction in September. According to CNBC, market pricing Monday implied a near-certainty that the Fed would cut by half a percentage point in September, followed by similar-sized reductions in November and December for a cumulative 1.25%. Interest rates are currently at 23-year highs.
Although stocks rebounded later in the week on more positive labor market news, Monday’s rout can be seen as a trial run for what happens to gold when the Fed actually lower interest rates.
The precious metal climbed as high as $2,476 an ounce last Friday, Aug. 2, before plunging over $100 to $2,367 on Monday. However, by the end of the day gold was back above $2,400.
This was just on the specter of falling rates.
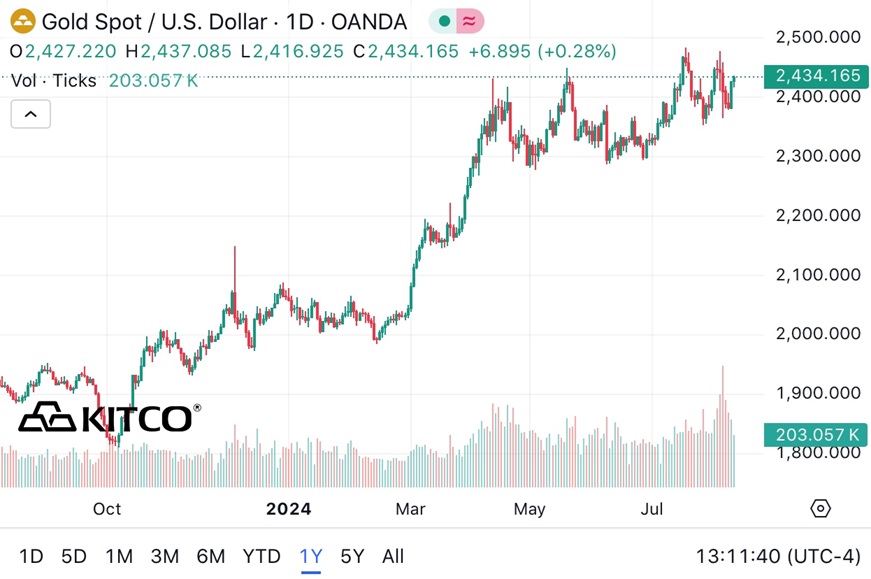
One-year spot gold. Source: Kitco
As expected, US government bond yields and the dollar slumped.
The benchmark 10-year Treasury yield sunk to 3.68%, while the US dollar index DXY was reduced to 102.19. By Thursday DXY had recovered to 103.24 and the 10-year was at 3.99%.
Both economic indicators generally move in the opposite direction to gold prices. Gold tends to perform well when interest rates fall below zero otherwise known as “negative real rates” (10-year yield minus inflation). We aren’t there yet. June’s inflation rate was 3%, leaving a positive real rate of +0.99%.
Record Q2 demand
While gold is influenced by the US dollar, inflation and interest rates, like any market, prices are determined by supply and demand.
The World Gold Council tracks gold demand closely and puts out an annual report and quarterly reports.
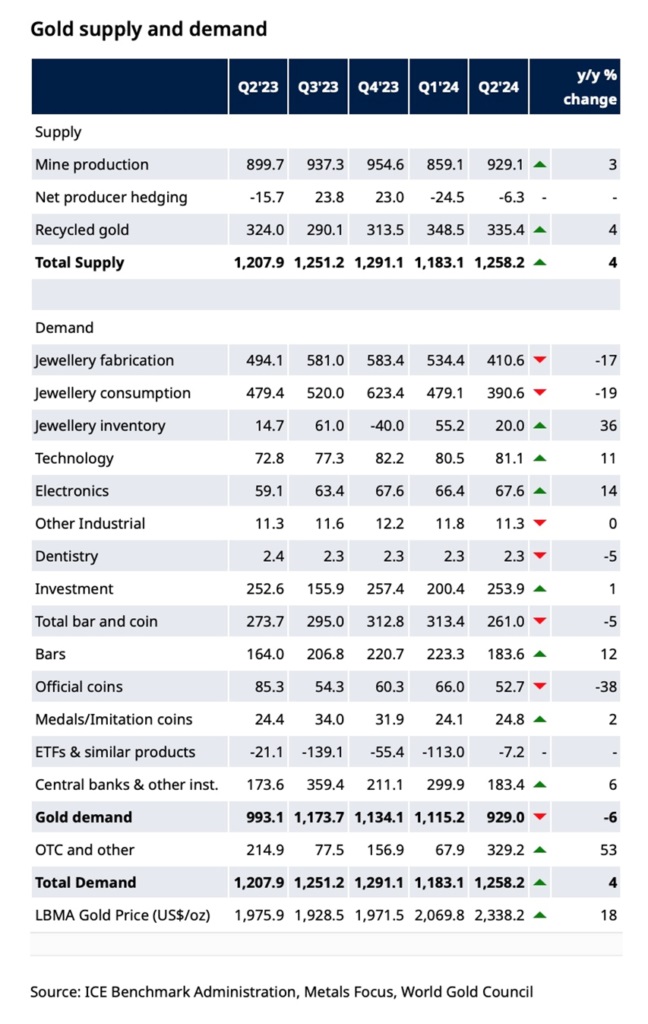
In its latest, second-quarter report, the WGC shows global demand for gold increased 4% year on year to 1,258 tonnes. This is the highest of any Q2 on record.
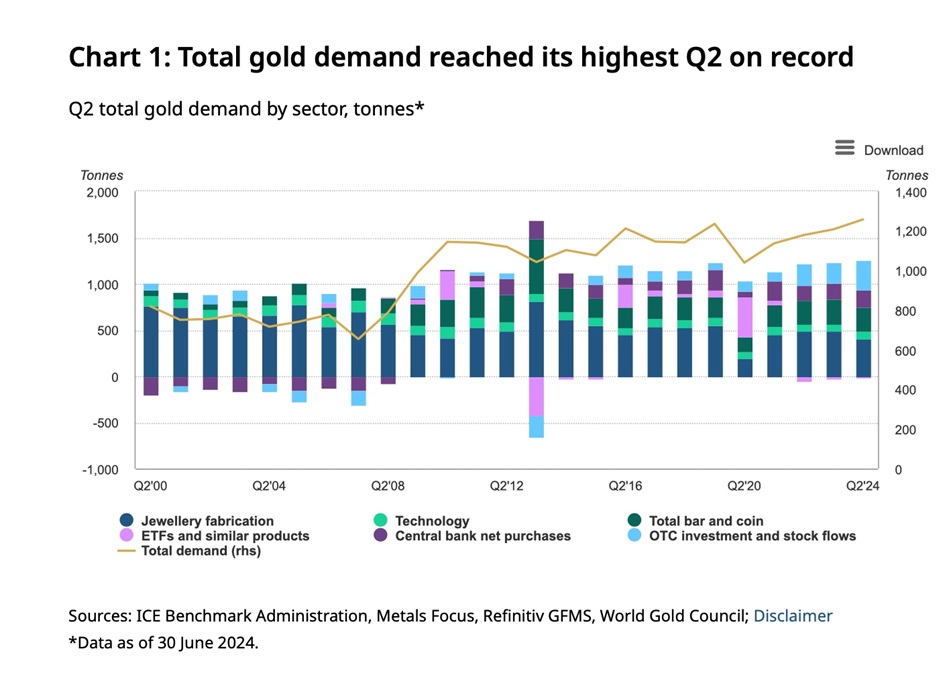
Source: World Gold Council
Over-the-counter (OTC) transactions were up 53% y/y at 329 tonnes.
(OTC markets involve market participants trading directly with each other. The two counterparties to a trade agree on a price and have obligations to settle the transaction (exchange of cash for gold) with each other. — The World Gold Council)
Central banks bought 183 tonnes on a net basis, 6% higher than the second quarter of 2023.
Some central banks are diversifying to currencies other than the US dollar following Russia’s invasion of Ukraine. When the United States punished Russia by freezing half of its $640 billion in gold and FX reserves, other countries thought “the same thing could happen to them”. Among the countries on a path to “de-dollarization” are Russia, China, India, Turkey and Saudi Arabia.
Furthermore, commodity-producing countries have started conducting trade in currencies other than the greenback. For example, India has purchased Russian oil in UAE dirham and roubles, China paid for $88 billion worth of Russian oil, coal and metal in yuan, and Chinese state-owned oil company CNOOC and France’s TotalEnergies last year completed their first yuan-settled LNG trade.
Wolf Richter of Wolf Street notes, It’s not that central banks are “dumping” their dollar-assets – in dollar amounts, their dollar-holdings haven’t changed all that much. It’s that they take on assets denominated in many alternative currencies, and as overall foreign exchange reserves grow, the dollar’s share of the total shrinks…
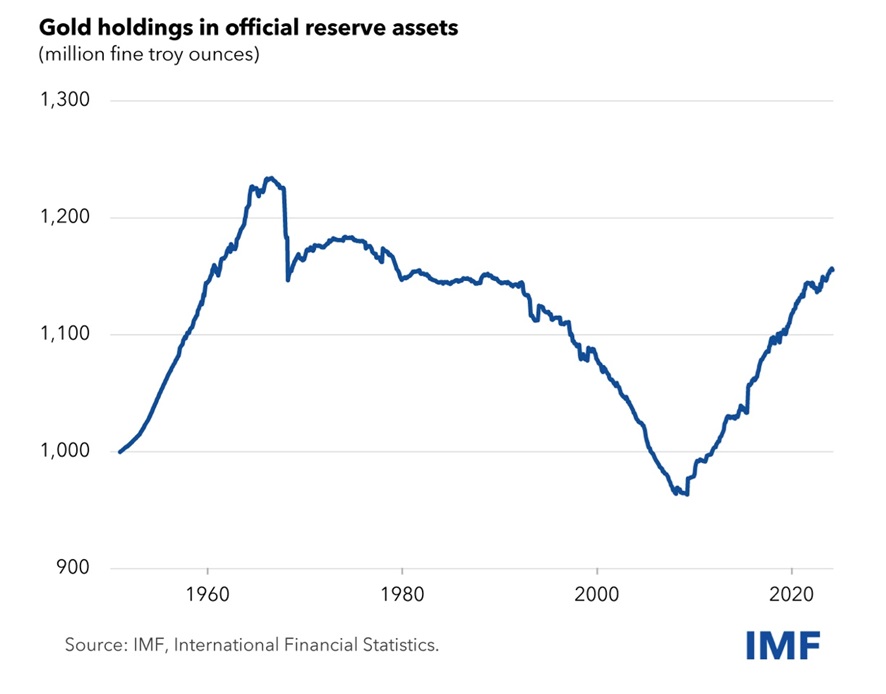
Bullion holdings are included in “reserve assets” of central banks. After decades of shedding their holdings, CBs are rebuilding them. According to the IMF, they’re currently at 1.16 billion troy ounces – roughly $2.7 trillion of $12.3 trillion in foreign exchange reserves.
Economist Daniel Lacalle believes central banks are buying gold to offset their own money destruction, i.e. inflation.
In fact, one could say that the world’s central banks anticipate their own widespread erosion of the purchasing power of reserve currencies due to the saturation of fiscal and monetary policies, and for that reason, they need more gold.
WGC says between OTC demand and continued central bank buying, gold reached a record $2,427/oz during the quarter. The precious metal averaged $2,338 in Q2, 18% higher y/y.
Investment demand for gold bars, coins and ETFs was “marginally firmer” at 254 tonnes.
Outflows from gold ETFs slowed to just 7 tonnes, compared to 113 tonnes out in the first quarter. Combined May and June inflows of 26t largely offset April’s 33t outflow. Asian gold ETFs hit their largest quarterly inflow on record, of 31t.
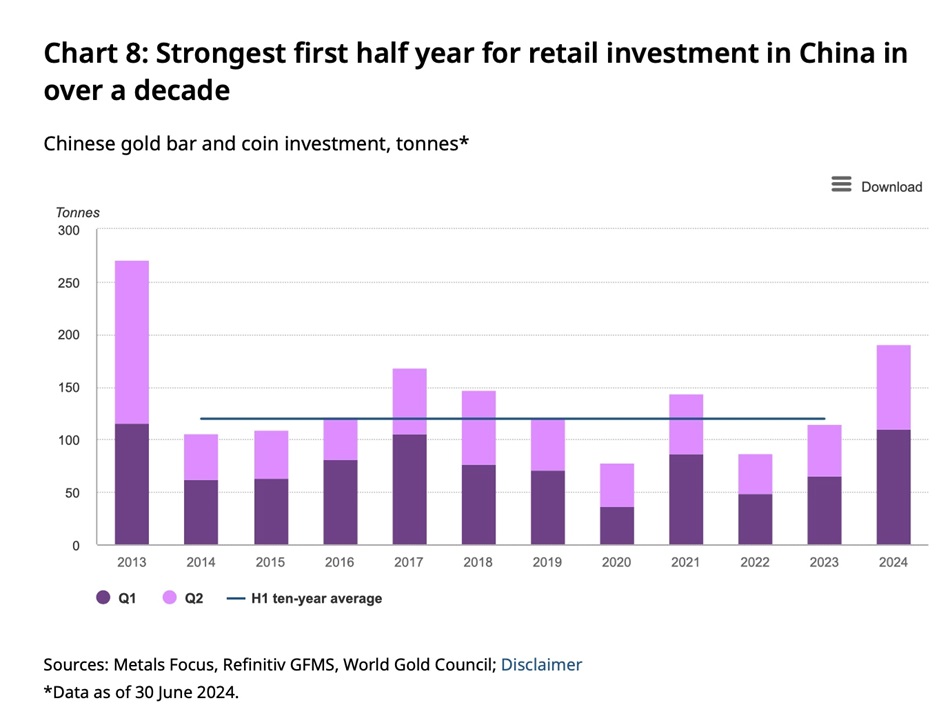
Bar and coin buying strengthened across Asia — in China it rose 62% y/y to 81t, the best Q2 since 2013 — but this was offset by lower demand in Western markets, where liquidation and profit-taking surged, particularly in Europe.
Indian bar and coin investment saw second-quarter demand of 43t, that combined with Q1, resulted in the highest first half since 2014.
In Vietnam, bar and coin demand jumped 30% y/y to 12t. Total demand for H1 of 26t was the highest since 2014. Bar and coin investment in Thailand saw 22% y/y growth to 7t.
Peak gold
In a world of resource depletion, it falls to gold exploration companies to fill the gap with new deposits that can deliver the kind of production required to meet gold demand, which is currently out-running supply.
The gold market continues to experience tightness due to difficulties expanding existing deposits, and a pronounced lack of large discoveries in recent years.
In 2023, 4,448 tonnes of gold demand minus 3,644t of gold mine production left a deficit of 804t. Only by recycling 1,237t of gold jewelry could the demand be met. (The World Gold Council: ‘Gold Demand Trends Full Year 2023’)
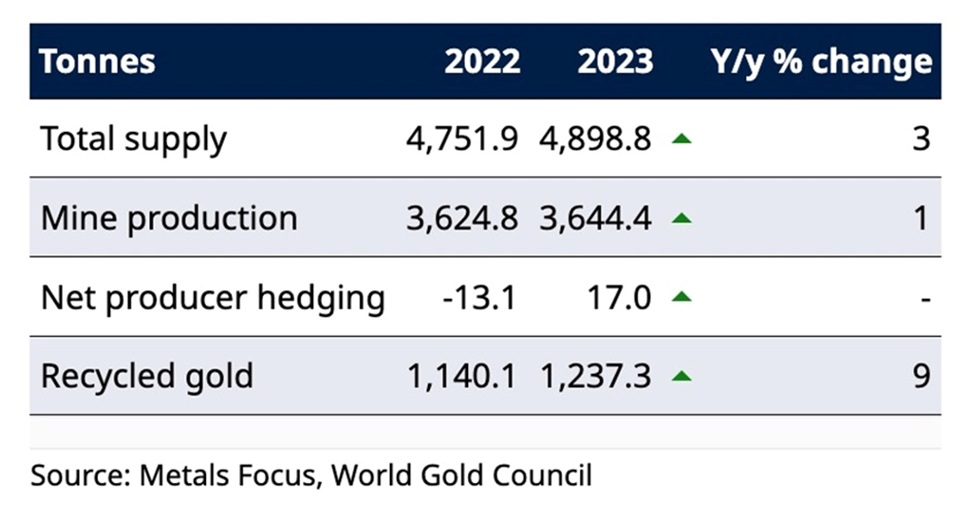
This is my definition of peak gold. Will the gold mining industry be able to produce, or discover, enough gold, so that it’s able to meet demand without having to recycle jewelry? If the numbers reflect that, peak gold would be debunked. We’ve been tracking it for years, and it hasn’t happened yet.
In Q2, gold supply rose 4% year on year, with mine production increasing to 929 tonnes. But again, the amount mined wasn’t enough to meet the demand without recycling (primarily jewelry).
Only by recycling 335.4t of gold jewelry could the total demand, 1,258.2t, be met. (1,258t – 929t = 329t, a deficit)
The World Gold Council reported recently that the gold mining industry is having difficulties maintaining production growth due to gold deposits getting scarcer.
Mine production rose just 0.5% in 2023 compared to 2022.
“It’s getting harder to find gold permit it finance it and operate it,” said John Reed, WGC’s chief market strategist, via The Jerusalem Post.
WGC confirmed what we at AOTH have known for years, that mine production plateaued in 2016-18 with no significant growth since. In 2020 gold production dropped for the first time in a decade, by 1%.
WGC offered two reasons why it’s been a struggle to maintain production growth: new gold deposits are harder to discover, as many potential areas have already been explored; and the fact that large-scale gold mining is extremely capital-intensive. It often requires 10 to 20 years for a mine to go from discovery to production, and only about 10% of gold discoveries become mines.
It is increasingly difficult, and taking longer, for mining companies to secure government permits. Many proposed projects are in areas that lack the required mining infrastructure such as roads and power, adding to the cost of building and financing these operations, Reed noted.
US has second-longest mine development timeline in the world, S&P Global says
According to WGC, only around 212,582 tons of gold have been mined throughout history, predominantly from China, South Africa and Australia (187,000 tonnes). Gold reserves suitable for excavation are estimated at about 57,000 tons, according to the US Geological Survey.
WGC also cited another familiar statistic: If every single ounce of mined gold were placed next to each other, the resulting cube of pure gold would only measure around 22 meters on each side.
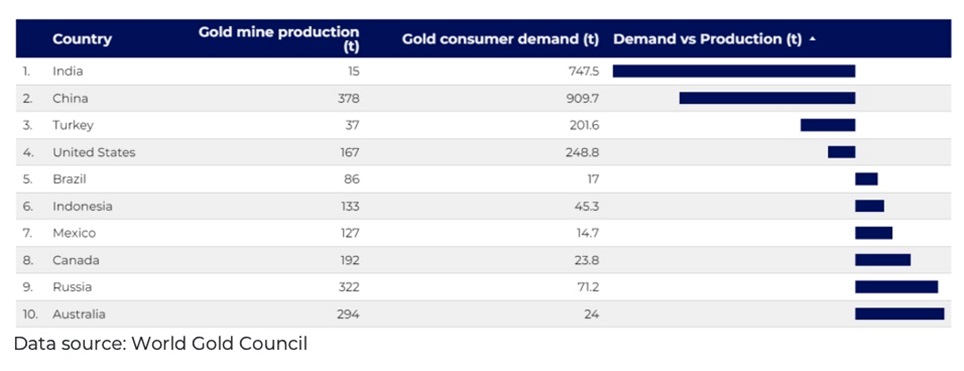
Among the countries falling behind on gold production, India tops the list according to a new study carried out by The Gold Bullion Company using demand-supply data from the World Gold Council.
As a top gold-consuming country, India demanded more than 747 tonnes in 2023. However, with just 15.1 tonnes mined, demand was 50 times the supply last year.
Second-place China also fell far short, with the country mining about half of its annual gold demand of 909.7 tonnes.
Number three Turkey only mined 36.5 tonnes, six times less than the 201.6t of gold demanded.
Next was the United States. Its 166.7 tonnes of mined gold in 2023 fell about 80 tonnes short of demand.
Conclusion
Gold juniors historically offer the best leverage against rising gold prices — better than major and mid-tier gold miners.
It hasn’t happened yet.
The gold price is up 18.9% year to date, but gold stocks have lagged the price. Not by much. The VanEck Gold Miners ETF (GDX) started the year at $30.56 a share and is currently at $35.84, a gain of 17.2%.
Its junior cousin, the VanEck Junior Gold Miners ETF (GDXJ), is up 14.4% YTD.
Both have slid since peaking in mid-July.
Admittedly we are in the summer doldrums, but there is reason for hope. Gold analyst Adam Hamilton reminds us of gold’s seasonality:
Starting in late summers, Asian farmers begin to reap their harvests. As they figure out how much surplus income was generated from all their hard work during the growing season, they wisely plow some of their savings into gold. Asian harvest is followed by India’s famous wedding season.
Indians believe getting married during their autumn festivals is auspicious, increasing the likelihood of long, successful, happy, and even lucky marriages. And Indian parents outfit their brides with beautiful and intricate 22-karat gold jewelry, which they buy in vast quantities. That’s not only for adornment on their wedding days, but these dowries secure brides’ financial independence within their husbands’ families.
So during its bull-market years, gold has tended to enjoy sizable-to-strong autumn rallies driven by these sequential episodes of outsized demand. Naturally the gold stocks follow gold higher, amplifying its gains due to their profits leverage to the gold price. Today gold stocks are once again back at their most-bullish seasonal juncture, the transition between the typically-drifting summer doldrums and big autumn rallies.
North American investors have been fixated on the AI stock bubble and have so far ignored gold. Chinese investors and central banks have been the demand drivers supporting the price.
When the strong possibility of a 50-basis-points rate cut in September is added to the mix, precious metals (gold & silver) and the companies exploring for them look, to me, like a coiled spring about to be sprung.
Richard (Rick) Mills
aheadoftheherd.com
subscribe to my free newsletter
*********
share
share
share
share
share