Gold Taps Our Year’s Forecast High of 3262


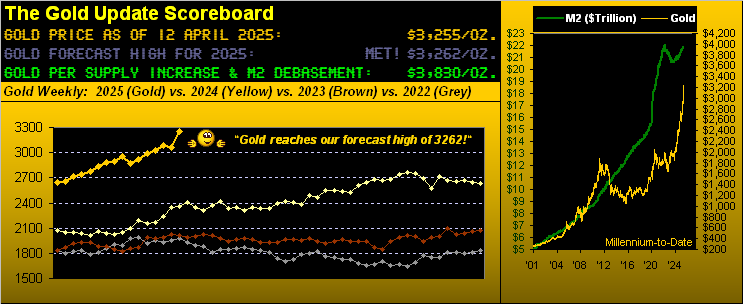
On Friday at 13:33 GMT, June Gold traded at 3262. ‘Tis our forecast high for this year as selected at New Year, and completes the triad of our three Golden Goals for 2025.
As Friday’s session further unfolded, Gold retrenched, but briefly then made it to a point higher still at 3263 — the new All-Time High — before settling the week at 3255. And the five-day low-to-high run (2970-to-3263) of +9.9% was Gold’s best intra-week percentage gain since that ending 14 August 2020 when COVID covered the cosmos.
Yet on to “The Now” as straightaway we go to Gold’s weekly bars from a year ago-to-date, which look nothing but great, price having made it to 3262 plus that extra point as icing on the cake:

Given 2025’s eventual total of 252 trading days, Gold reached our forecasted 3262 in just 70 sessions, which for those of you scoring at home means 72% of the year is still in the balance.
Thus the obvious question begged is: “Where Do We Go from Here?” –[Chicago, ’70].
Despite Gold having already achieved our upside goal, our call for getting there has been completely upside down. En route to 3262, we’d anticipated Gold initially to pullback lower into the 2800s/2700s/2600s, even specifically to as low as 2507(!) Instead through these first 15 weeks of 2025, just two have been down. Such like stint hasn’t occurred since having penned the second edition of The Gold Update away back on 28 November 2009!
But to Pete Cetera’s above crooning question, remember our writing at New Year that “…applying the ‘expected yearly trading range’ method, the year’s low approximates … 2507. Then would follow the ascent to [the] forecast high of 3262…”
Our good man Squire then later questioned: “But mmb, what if the 2625 low is already in for this year?” to which we responded “…were that to turn out to be the case, then our forecast for a 3262 year’s high may be deemed in hindsight as modest.”
Similar was the case last year (for which we sought 2375, price then moving well beyond that to 2802). And now year-to-date, the low of 2625 (06 January) remains in place.
And thus as just penned this past 22 March: “…’IF‘ the low for this year is already in place … Gold has a shot at 3400 (or purely in the ‘expected yearly trading range’ equation, 3380), fundamentally supported by Federal Reserve interest rate cuts in concert with a slowing StateSide economy…” Yep, no kiddin’, keep readin’.
However, one only gets one shot at a forecast; re-forecasting is verboten! But given price’s present momentum, 3400 from here (+4.5%) seems a mere stone’s throw, barring it suddenly going all wrong for Gold.
That stated, the tug-of-war continues between Gold being technically near-term overbought vs. fundamentally broad-term undervalued. The latter case is made evident by the opening Gold Scoreboard, price today (3255) being -15% below its Dollar debasement valuation of 3830.
But by our BEGOS Markets’ value method, the following year-over-year graphic of Gold vis-à-vis its smooth valuation line (2962) shows price presently as +293 points — i.e. +10% — too “HIGH”:
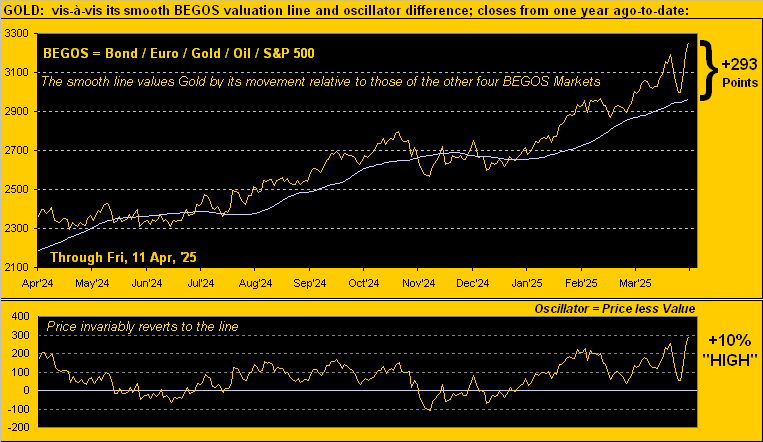
“So +293 points above value is pretty high, eh mmb? Congrats on the call, by the way…”
Thanks Squire. And indeed the current +293-point deviation is the second-highest century-to-date. ‘Twas only higher by +311 points upon the then All-Time Closing Gold High of 1900 back on 22 August 2011, from which in two months Gold fell -15% (snowballing to a -44% fall per the end of 2015). But more “recently” by percentage deviation, the last time ’twas by this much (+10%) was on 08 March 2022, after which price fell from 2058 to 1695 (-4.5%) come that year’s Bastille Day (14 July).
To be sure, if one labels “TT!” (“Trump Tariffs!”) as geopolitically Gold-boosting bedlam, price’s admirable rally is justifiable. The Dollar Index just took quite a hit in sporting a weekly settle below 100 for the first time since that ending (believe it or not again) on Bastille Day 2023. A Swiss Franc that day cost $1.1680 … today ’tis $1.2368. Got Gold? Got Swiss?? Here’s the solid “Safe-Haven Two-Fer” that one cannot miss: Miss Helvetia!
Such mirthful jubilation aside, you strident Gold aficionados well-understand what follows geopolitically-induced price spikes: reversion to the mean. Yes, we fully comprend that “It’s different this time” … ’tis always different this time … until ’tisn’t. We thus remain sensitively wary for Gold’s price to be suddenly jerked into reverse. Indeed such down stints have been lurking of late: on each of 03, 04 and 07 April, Gold recorded intra-day declines of more than -100 points; they’ve just been lost in the sensationalized shuffle.
Shuffling down net-net since mid-February is the Economic Barometer. Perhaps worse: are we DEflating? After all, the Bureau of Labor Statistics recording deflationary readings in three of its four key Price Indices for March: the headline paces at both the Consumer and Producer levels were negative as was the latter’s core pace. ‘Course the “Fed-favoured” paces of Personal Consumption Expenditures shan’t be released by the Bureau of Economic Analysis until 30 April. But should negativity also therein lie, the Federal Open Market Committee surely shall cut their Bank’s Funds Rate per the 07 May Policy Statement. Too, of the Baro’s nine incoming metrics this past week, just two were “positive”: March’s Treasury Budget was less negative, and Wholesale Inventories for February were worked down. So in going to the year-over-year picture, just as the stock market can be a hedge against inflation, so too can it be a broken dam to deflation as such ebbing tide lowers all boats:
Next we turn to trend consistency for the precious metals as measured by their baby blue dots. Below for Gold on the left, despite price’s “mega-spike” of nearly +200 points for the past week, the “Baby Blues” have become a bit unglued; certainly so for Silver on the right, the aforeshown Gold/Silver ratio at present a whopping 101.1x:
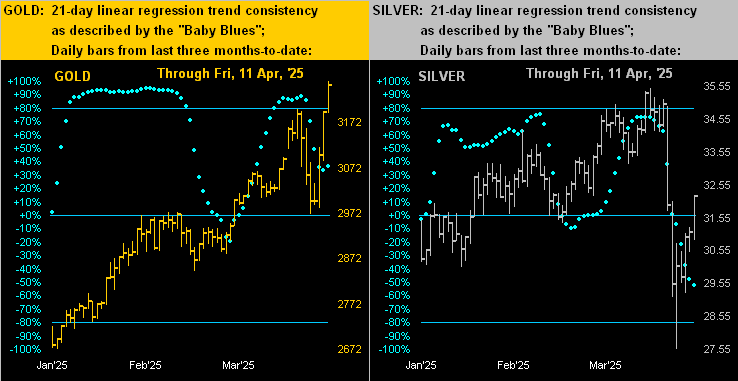
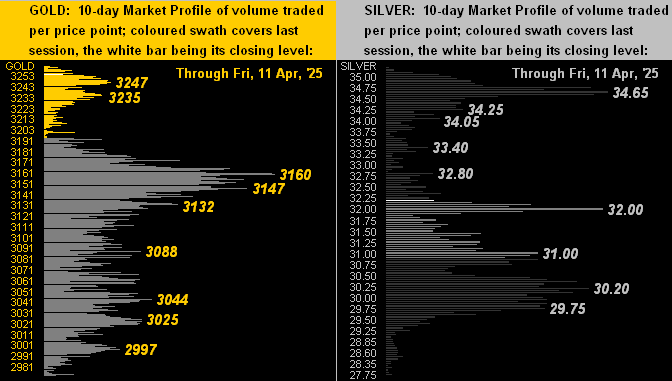
Thus as we view the 10-day Market Profiles for the yellow metal (below left) and white metal (below right), ’tis not surprising to find Gold’s closing white bar near the top of the chart, whilst that for Silver is mid-range. ‘Course the culprit there is Cousin Copper, the red metal within the past three weeks posting a high-to-low blow of -25% from 5.374 (26 March) to 4.030 (07 April). Oh those “TT!”
Toward the wrap, here’s the stack:
The Gold Stack
Gold’s Value per Dollar Debasement, (from our opening “Scoreboard”): 3830
Gold’s All-Time Intra-Day High: 3263 (11 April 2025)
2025’s High: 3263 (11 April 2025)
10-Session directional range: up to 3263 (from 2973) = +290 points or +9.8%
Gold’s All-Time Closing High: 3255 (11 April 2025)
Trading Resistance: none by the Profile
Gold Currently: 3255, (expected daily trading range [“EDTR”]: 75 points)
Trading Support: nearby 3247 and 3235, then 3160
10-Session “volume-weighted” average price magnet: 3116
The Weekly Parabolic Price to flip Short: 2970
2025’s Low: 2625 (06 January)
The 300-Day Moving Average: 2549 and rising
The 2000’s Triple-Top: 2089 (07 Aug ’20); 2079 (08 Mar’22); 2085 (04 May ’23)
The Gateway to 2000: 1900+
The Final Frontier: 1800-1900
The Northern Front: 1800-1750
On Maneuvers: 1750-1579
The Floor: 1579-1466
Le Sous-sol: Sub-1466
The Support Shelf: 1454-1434
Base Camp: 1377
The 1360s Double-Top: 1369 in Apr ’18 preceded by 1362 in Sep ’17
Neverland: The Whiny 1290s
The Box: 1280-1240
So does Gold’s stellar run stop here, essentially at our 3262 forecast high for this year? Until we actually experience the coming effect of “TT!”, its babble and prattle shall the markets still rattle. But like everything else, be it geopolitically, monetarily, financially or whateverly, “TT!” eventually will fall from the FinMedia headlines and, in turn, Gold experience descent to some extent. Either way, what a gut-grippin’ Gold ride we’ve spent!
Cheers!
…m…
www.TheGoldUpdate.com
www.deMeadville.com
and now on “X”: @deMeadvillePro
********

Mark Mead Baillie has had an extensive business career beginning in banking and financial services for two years with Banque Nationale de Paris to corporate research for three years at Barclays Bank and then for six years as an analyst and corporate lender with Société Générale.
For the last 22 years he has expanded his financial expertise by creating his own financial services company, de Meadville International, which comprehensively follows his BEGOS complex of markets (Bond/Euro/Gold/Oil/S&P) and the trading of the futures therein. He is recognized within the financial community of demonstrating creative technical skills that surpass industry standards toward making highly informed market assessments and his work is featured in Merrill Lynch Wealth Management client presentations. He has adapted such skills into becoming the popular author each week of the prolific “The Gold Update” and is known in the financial website community as “mmb” and “deMeadville”.
Mr. Baillie holds a BS in Business from the University of Southern California and an MBA in Finance from Golden Gate University.


