Gold Teases 2900; to 3000 Unencumbered?


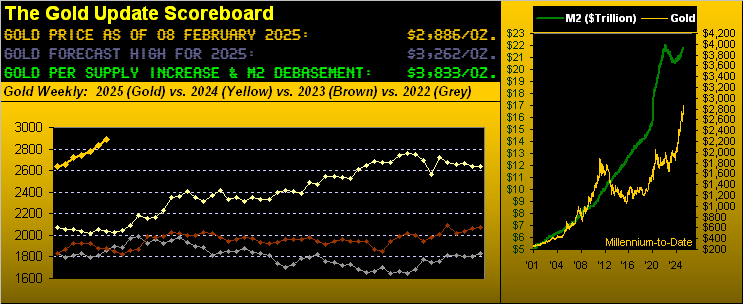
The price of Gold just completed its sixth consecutive up week, within which the past three thus far comprise the newest weekly parabolic Long trend. Indeed through this latest week, Gold continued to attain All-Time Highs, teasing yesterday (Friday) up through 2900 to 2910 before settling at 2886.
Moreover as you regular readers already know, our Golden Goal Two (of three) is the “milestone” level of 3000. And given Gold’s expected weekly trading range is now 93 points, within that vacuum, 3000 (+114 points from here) is certainly “within range” by month’s end. But are six consecutive up weeks already getting a bit long in the tooth for Gold?
Just in case you’re scoring at home, century-to-date there are now 1,258 trading weeks in the books. And therein we’ve had 176 Gold up streaks of two or more weeks. However, Gold’s having completed an up streak of at least six weeks (such as to now) has only happened 14 mutually-exclusive times, the record being 12 up weeks from 20 August 2007 through 09 November 2007 for a net price gain of +26%. As stated, this new weekly parabolic is but three weeks young per the rightmost blue dots…

…and as comprehensively detailed in our 25 January missive “Gold Goes Long with Three Golden Goals”, the average duration of the prior 10 such Long trends (dating back to December 2020) was 12 weeks. Further, the average price gain was +10.5% which as penned per our “Moderate assessment … would bring Gold 3069″.
‘Course, neither you, nor we, nor anybody “knows” when Gold 3000 shall trade. But because we do the math, hardly would we bet against it ever happening, and reaching 3000 not only this year but on this current weekly parabolic Long trend — even as noted with this month — is quite reasonable. And lest we forget more broadly, Golden Goal Three is our 3262 forecast high for this year, beyond which per the opening Gold Scoreboard, price by Dollar debasement already “ought be” 3833.
Still, six consecutive up weeks for Gold and our being aware of an inflationary scare could cause a Fed flare (again, should they dare), in turn substantiating a Gold price pare. For did you note yesterday’s +0.5% Hourly Earnings increase within January’s StateSide Non-Farm Payrolls? That ties as the largest such increase for just the third time across the past 27 months. And century-to-date, the average monthly increase is but +0.3%, itself annualized being +3.6% and thus above the Federal Reserve’s desired overall +2.0% pace. Oh that wily wage-push inflation! “Whoopsie…”
Too, by Gold’s broad-based 300-day moving average, price today is nearly +20% above such stalwart measure. Historically since 2001, such excesses have been met with an average decline of nearly -9% during the ensuing three months. Here’s Gold by the day since the 22 August 2011 then All-Time Closing High of 1900, the 300-day moving average as ever in blue:
Also using our BEGOS Markets’ (Bond / Euro / Gold / Oil / S&P 500) valuation tool which assesses the state of Gold relative to its movement vis-à-vis that of the other four components, price is at present +174 points above its “smooth valuation line” as is below seen per the lower panel oscillator (price less value). Whilst that can be deemed as “high”, ’tis nevertheless a testament to Gold’s year-over-year brilliant bull run:
Sporting a far more flat run for nearly the past six months is our Economic Barometer. To wit for the 16 incoming metrics during the week just past, period-over-period, eight improved and eight weakened: “flat” indeed. Amongst the standouts however, January’s ADP Employment data and both December’s Construction Spending and Consumer Credit levels all bettered their prior readings, all of which were in turn revised upward, and beat consensii. But those losing out in all three like categories were January’s Average Workweek (in hours) along with the Institute for Supply Management’s Services Index, December’s Factory Orders and Trade Deficit, plus the prior week’s Initial Jobless Claims. A clash of many metrics indeed! Here’s the Baro:
As for the S&P 500, its futures contract these past two Mondays saw substantive opening down gaps such that price intra-day fell -3.0% (27 January) and -2.1% (03 February); but in both cases, the gaps filled all the way back up. Has investing become this easy? Indeed, has the Investing Age of Stoopid become an eternal paradigm? Recall the Wall Street Journal front-and-center piece back pre-DotComBomb about some folks actually believing stock prices only go up? For all who still frolic in the complacent equities’ froth, we again humbly offer this one reminder: the same-day “lock limit down” halts for the S&P futures are -7%, then -13%, and finally -20% (which for you WestPalmBeachers down there means “TILT! Game Over!“)
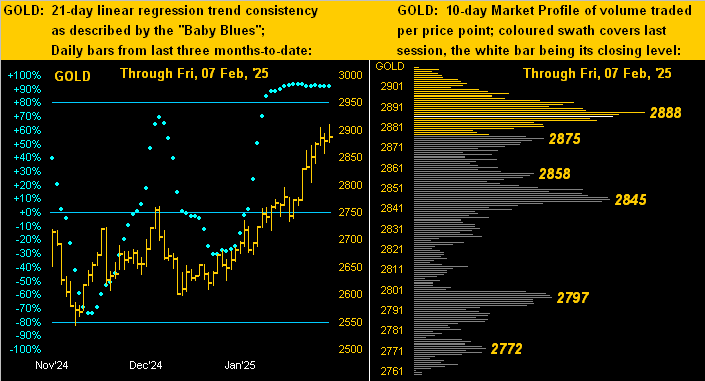
But for Gold, ’tis been nothing but “Game On!” Below we’ve our two-panel display featuring the yellow metal’s daily bars from three months ago-to-date on the left and 10-day Market Profile on the right. The baby blue dots of regression trend consistency quite literally have pasted themselves upon the ceiling, which if we may reprise, suggests this fabulous uptrend may seeking at least some near-term bend. Per the Profile, Gold’s volume-dominant support levels are 2845, 2797 and 2772:
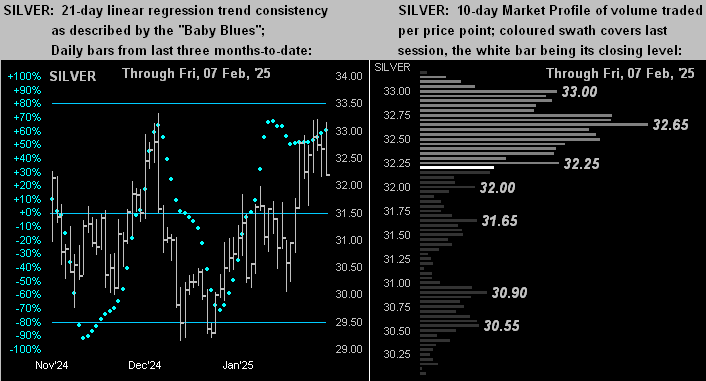
Again perhaps not as robust as that for Gold — but sterling nevertheless — is the like graphic for Silver, her daily bars (below left) and Profile (below right). And as we’ve be saying week-in and week-out for some four years, Silver as gauged by her ratio from Gold (currently 89.7x) remains cheap, the ratio’s century-to-date average being 68.7x. Indeed priced to that average today, Silver rather than at her current 32.19 price would instead be 42.00. But we know you shan’t forget Sister Silver:
So to sum it all up: Gold is having a fabulous run, that realistically shall become at least a bit undone given the reality which herein penned a week ago that “hardly are markets unidirectional”.
Yet so stated, per our title, is the tease at 2900 to in turn bring 3000 unencumbered? Such query puts us back in mind better than 20 years ago when (admittedly out of ignorance) we’d gawk at FinTV thinking we could be on the cutting edge of markets’ directions.
“Oh that was pretty ignorant, mmb…”
Squire, your affirmation of such is illustriously inspiring. But to our point: rumbling ’round the floor of the New Stock Stock Exchange in those days was one Arthur D. Cashin, Jr. And we’ve always remembered this quip from him: “Usually, if a stock gets to 90, it’s goin’ to 100.”
Thus by such theory you can see where we’re going with this: Gold having now reached 2900 means ’tis going to 3000, albeit by what we’ve herein noted today, perhaps not directly … but eventually. Because as aforementioned, Golden Goal Three for this year remains our forecast high for 3262!
Cheers!
…m…
www.TheGoldUpdate.com
www.deMeadville.com
and now on “X”: @deMeadvillePro
********

Mark Mead Baillie has had an extensive business career beginning in banking and financial services for two years with Banque Nationale de Paris to corporate research for three years at Barclays Bank and then for six years as an analyst and corporate lender with Société Générale.
For the last 22 years he has expanded his financial expertise by creating his own financial services company, de Meadville International, which comprehensively follows his BEGOS complex of markets (Bond/Euro/Gold/Oil/S&P) and the trading of the futures therein. He is recognized within the financial community of demonstrating creative technical skills that surpass industry standards toward making highly informed market assessments and his work is featured in Merrill Lynch Wealth Management client presentations. He has adapted such skills into becoming the popular author each week of the prolific “The Gold Update” and is known in the financial website community as “mmb” and “deMeadville”.
Mr. Baillie holds a BS in Business from the University of Southern California and an MBA in Finance from Golden Gate University.


