In Gold We Trust 2013

Today the main factor influencing financial markets seems to be the anticipation of central bank actions. Historical market patterns have been radically altered over recent years. Since 2009 the Fed has reacted to every economic slowdown by introducing fresh easing measures, so that a paradoxical situation can be observed by now: disappointing macroeconomic data lead to price increases in stocks, as a continuation, respectively expansion of the QE program is priced in. Better than expected macroeconomic data on the other hand lead most of the time to price declines, as a reduction of future QE is anticipated.
Prior to the beginning of QE1, the historic correlation between the balance sheet of the Federal Reserve and the S&P 500 Index was 20%. Since 2009, this correlation has increased to 86%. The expansion of the money supply thus has had a bigger effect on the stock market than the trend of corporate profits. This relationship has been acknowledged by the Federal Reserve who argued in a study that, absent intervention by the central bank, the S&P 500 would be 50% lower.
The reason for this behavior is the so-called 'Greenspan Put'. It describes the fact that a general decline in asset prices (e.g. stocks, real estate) impairs consumption and thereby triggers economic crises. As a countermeasure, the central bank is supposed to counteract such situations by means of expansive monetary policy measures. Since stock market traders rely on these interventions on the part of the central bank, the implicit insurance by the Fed has been labeled the 'Greenspan Put'. In order to stimulate economic activity, the Fed once again relies – as it has already done in the previous US economic cycle – on the so-called 'wealth effect'.
This results in an increase in 'moral hazard'. The term originally stems from the insurance industry. It describes the phenomenon that people that have fire or car insurance are actually taking less care to avoid damages than those who are uninsured. Negative consequences respectively costs of human action are not borne by the acting persons themselves, but are transferred to third parties (in this case insurance companies). The insured are even made whole (or partly made whole) for their own misbehavior, while profits from their own actions are exclusively retained by the actors themselves. This attitude can be observed in all kinds of spheres of life. According to Jill Fredston, an expert on avalanches, better safety equipment tempts mountaineers and ski tourers to engage in more risky behavior – and thus makes them de facto less safe .In further consequence this creates systemic incentives to act at someone else's expense . Financial participation in the form of retentions can provide a remedy for moral hazard.
2. ASSESSMENT OF THE CURRENT CORRECTION AND THE MOST RECENT EVENTS
After our price target of $2,000 formulated last year was clearly missed, we must engage in self-criticism. We therefore want to analyze the reasons for the weakening of the gold price.
a) Reasons for the current correction of the gold price
The following factors were, respectively are, decisive for the weakness of the gold price:
- Disinflation
- the outlook of QE being tapered and eventually exited
- rising real interest rates
- partly declining money supply (especially ECB)
- record high short positions
- backwardation since April 5, which has intensified
- rising opportunity cost of owning gold due to the rally in stocks
- ETFs: the majority of the outflows were from the SPDR gold trust ETF, and thus probably mainly initiated by US investment managers who are turning away from gold in order to switch into the rallying stock market
- tightening credit spreads
- cascading sell orders by trend-following systems, CTAs, managed futures accounts, etc., as the technical support level of $1,530 was violated
- increasingly negative analyst opinions (among others, Goldman Sachs, Credit Suisse, Société Générale,...)
Even though the consensus currently assumes that the gold bull market has ended, we are of the opinion that the fundamental case continues to be intact, more than ever. We believe that the correction that has been in train since September 2011 exhibits strong similarities to the mid cycle correction of 1974 to 1976. That period is similar to the current one specifically on account of marked disinflation, rising real interest rates and extremely high pessimism regarding investment in gold.
Mid Cycle Correction 1974 to 1976 vs. Current Correction
(indexed to 100)

Source: Datastream, Incrementum AG
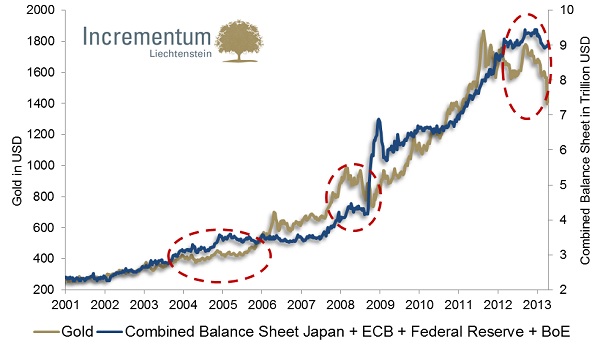
A slight monetary disinflation can be discerned in the following chart. It shows the combined balance sheet totals of the Federal Reserve, the ECB, the Bank of England and the Bank of Japan. Since the money supply has decreased in the euro zone and the UK (which has however been partially compensated by the Fed and the Bank of Japan), this may also have had an effect on the gold price.
Combined Balance Sheet Totals Fed+ECB+BoE+BoJ in USD trillion
Source: Bloomberg, Datastream, Incrementum AG
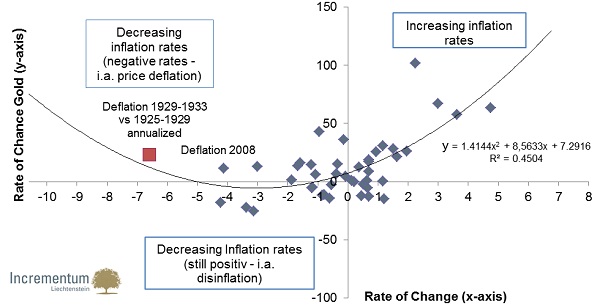
Many analyses attest to gold's inflation hedging characteristics. There are however also a great many critical voices that opine that gold and inflation rates show no statistical correlation, and that its usefulness as an inflation hedge is therefore a fairy tale. We have looked into this question and are of the opinion that it is important to establish the following connection: gold doesn't correlate with inflation rates, but with the change in inflation rates. In order to buttress this hypothesis we have calculated the following regression.
Change in Inflation Rate vs. Change in Gold Price
Source: Incrementum AG, Fed St. Louis
Explanatory note: the regression is based on annual data since the end of the Bretton Woods agreement in 1971. However, the data point in red is not part of the regression calculation. It only serves as an illustration of the situation in the time period prior to 1971 when the last significant move in the gold price has occurred. In our opinion, the data point fits astonishingly well into the regression curve and supports the thesis that gold tends to exhibit a nominally positive trend during periods of price deflation. Disinflation periods (this is to say, declining inflation rates still in positive territory), which we are currently experiencing, are therefore the worst possible environment for gold.
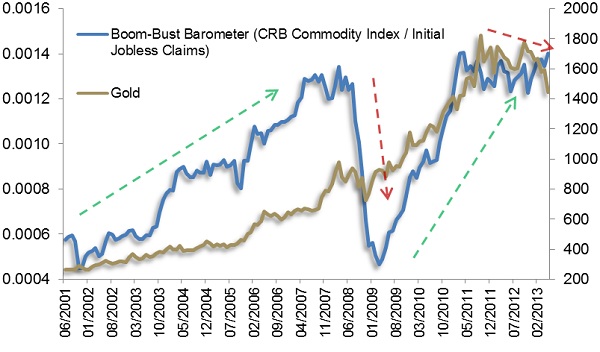
The current predominance of disinflationary, respectively deflationary forces, can be gleaned from the following illustration. It shows a ratio between commodity prices (the CRB index) and initial jobless claims (left hand scale) as well as the gold price in comparison thereto (right-hand scale). A rising boom/bust ratio indicates expansionary economic periods, while a falling ratio illustrates deflationary pressures.
Boom-Bust Barometer (CRB Commodity Index / Initial Jobless Claims) vs. Gold
Source: Incrementum AG, Bloomberg, Datastream
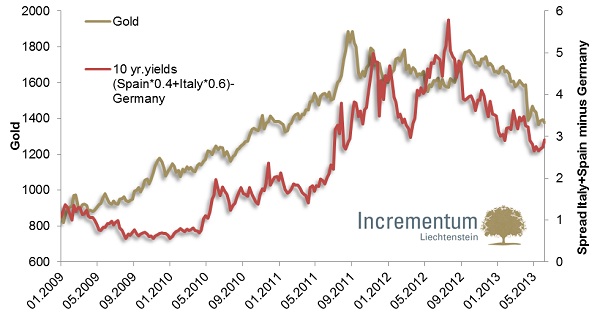
The next chart shows that the price of gold is suffering from the (temporary) return of confidence in the euro zone. The yield spread between Italian and Spanish relative to German government bonds has been declining markedly for several months and is currently at the lowest level since May 2011. That signals that tail risks in the euro zone have lately been priced out.
Spread Between Italy & Spain over Germany versus the Gold Price
Source: Erste Group Research, Incrementum AG, Datastream
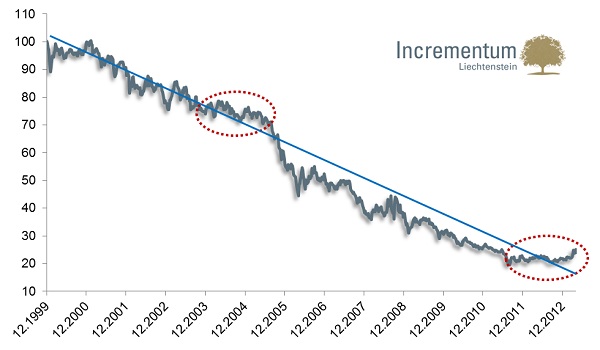
The long term downtrend of most currencies relative to gold can be discerned from the following chart. The downtrend of the equal-weighted currency basket has however recently flattened and moved away from its trendline. A similar phase was already in evidence in 2003 and 2004. Nevertheless, one must definitely keep an eye on the relative weakness of gold versus the basket.
Currency Basket Measured in Terms of Gold: Long Term Downtrend Intact, Currently However Bottoming?
Source: Datastream, Incrementum AG
a) Paper Gold versus Physical Gold
The April crash showed how important it is to differentiate between the 'gold price' and the 'price of gold'. The gold price refers most of the time to the price of a gold futures contract, e.g. at the COMEX. The price of gold by contrast is the price one must pay if one wants to buy physical metal.
These spot and futures prices are connected via arbitrage and for that reason cannot, in principle, move diametrically away from each other. Nevertheless, an understanding of the link between these two markets is necessary to correctly interpret events in the markets. In the present environment, there are for example considerable mark-ups, supply bottlenecks in the physical (cash) market.
Many aspects of the April crash were unusual. For the first time, record high, anti-cyclical demand in the physical market could be observed on a global basis in the course of a large price correction:
- the US Mint's sales soared to 210,000 ounces in April (+950% compared to a year ago, resp. a tripling compare to March)
- premiums for gold in Hong Kong rose to the highest level in two years
- China's gold imports from Hong Kong rose to an all-time high of 223 tons
- in India, physical demand rose to an all-time high in April (+138% y-o-y)
- dealers in Europe, but also in Australia or the US reported supply bottlenecks
The true importance of gold lies in its possession, not its price. A gold price decline or increase by 5% barely has an effect on physical possession, since probably only a share amounting to tenths of a percent of the total available stock changes ownership. The paper market by contrast consists of countless promises issued by a vast variety of counterparties. One should therefore refrain from equating participation in a price movement with ownership of an asset. There is for instance a fundamental difference between ownership of a cattle futures contract and being a farmer who raises cattle.
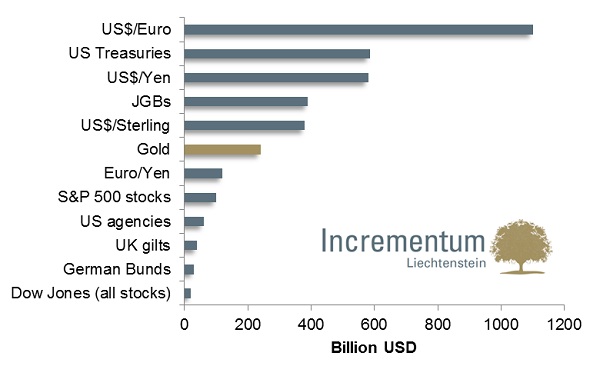
The paper gold market has grown exponentially in recent years. Originally it was created to help miners to hedge and mine developers to finance the development of mines. In the meantime the paper gold market has become one of the most leveraged markets. According to an LBMA study , total trading volume in 2011 amounted to 50 billion ounces. That is 600 times annual production. According to the study, 10.9 billion ounces of gold worth a total of 15,200 billion dollars were traded in the first quarter of 2011. That equals 125 times annual production, or twice the entire amount of gold ever mined. 240 billion dollars in trading volume per day amounts to more turnover than in most currency pairs. Insofar, gold is one of the most liquid investment assets in the world.
Daily Trading Volume in Billions of Dollars
Source: World Gold Council, Incrementum AG
b) Technical Analysis: Sentiment and CoT Report Signal Bottoming Process
In the course of the price collapse, massive technical damage has been inflicted. We are therefore firmly convinced that repairing the technical picture will take some time. In light of the basic technical rule “support becomes resistance, resistance becomes support”, the $1,530 level should represent very strong resistance for the time being.
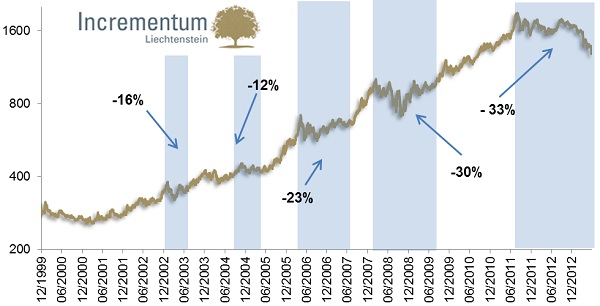
When gold reached its all-time intraday high at $1,920, the price traded three standard deviations above the 40 day moving average. Only two times in the course of the current bull market (May 2006 and March 2008) was the gold price similarly overbought. In both cases, sharp corrections followed suit. Based on the following chart one can see that the current correction is approximately similar in extent to the correction of the years 2008-2009. The duration of the correction (blue column) however is clearly above average.
Correction Periods since the Beginning of the Bull Market
(log scale)
Source: Incrementum AG, Datastream
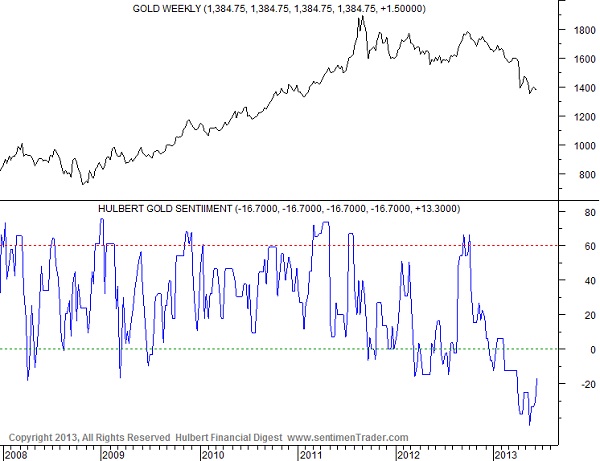
The fact that sentiment is by now at the most negative level since the beginning of the bull market, gives us cause to be clearly positive about the long term. Sentiment indicators like e.g. Market Vane, the Hulbert survey and Rydex precious metals fund cash flows show that the gold price is miles away from excessive euphoria. According to the Hulbert Financial Digest, the allocation recommended by gold newsletter writers was recently at minus 44%, an all-time low.
Hulbert Gold Newsletter Sentiment Index
Source: Sentimentrader.com
The commitments of traders report (CoT) currently shows – from a contrarian perspective – a clearly positive situation. It confirms that a great deal of speculation has been wrung out of the sector in the first half of this year. Many trend-following speculators in COMEX gold futures have apparently not only thrown in their bullish towels, but have embraced the downward momentum for gold by selling futures short. On the other hand, large commercial interests, the natural hedgers, considered by many as the “smart money” in gold futures, have very strongly reduced their net short positions. From October of 2012 to June, 2013, the commercial hedgers reduced their net hedges (net short futures positions) by 84%. They currently hold the smallest net short position since February, 2005. This means that the largest, most deep-pocketed and best informed traders have positioned themselves for higher gold prices.
Compared to October of last year, large and small speculators have decreased their net long positions by 91% and 99% respectively. For the same period the large speculators have increased their gross short positions seven-fold to record high bets the price of gold will fall further. Because they tend to trade with the current trend and momentum, generally more short-term oriented speculators reach their highest gross short positions at or near important long-term low turning points for the price of gold. Conversely, the commercials seek to hedge longer-term price risk. Commercial hedgers tend to reach their least net short positions at or near important gold price lows.
The commercial hedgers have not been net long gold since 2001 with gold then near $270, but following the 30-plus percent correction for gold since September, 2011, the industry hedgers and bullion banks are now the closest to becoming net long in 12 years. Indeed, on June 4, 2013 U.S. bullion-trading banks reported a 29,622-contract net long position for the first time since July of 2008 during the financial crisis with gold then USD $939. In our opinion this signals an attractive counter-cyclical entry point. The current positioning data in the futures market are what we would only expect in a mature downtrend and are a recipe for a pronounced rally.
CoT Report
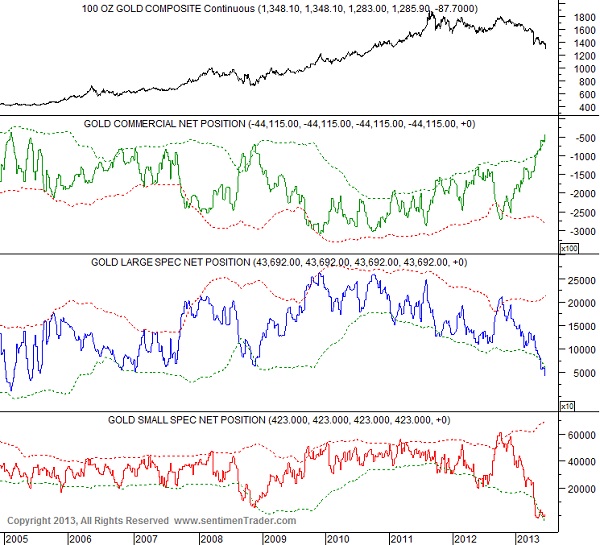
Source: Sentimentrader.com
Technical Analysis, Conclusion
Since the all-time high in August 2011, the gold price is in a long term consolidation phase, similar to the mid cycle correction of 1974-1976. As a result of extremely negative sentiment and the clearly positive implications of the CoT data, we assume that we will soon enter a bottoming process. From a seasonal perspective, not much momentum is expected before August.
3. ESSENTIAL FEATURES OF GOLD
a) The Relative Scarcity of Gold versus Fiat Currencies
"If you can’t explain it to a six-year-old, you don’t understand it yourself." Albert Einstein
Gold's supply curve only changes incrementally every year. First and foremost scrap supply is volatile, while mine production is extremely inelastic. This is one of the major virtues of gold in contrast to paper currencies which can be produced in unlimited quantity. Confidence in the future purchasing power of money depends crucially on how much money is currently available and how the money supply is expected to change in the future.
One can see this relative scarcity in the following illustrations. Between 1868 and 2011, the average growth rate of the monetary aggregate M2 was 6.6%, while the stock of gold grew only by 2.1%. M2's historical volatility was also far higher, it ranged from minus 15.6% to plus 26%, while that of gold ranged only between 1.4% and a maximum of 3.5%.
Maximum, Minimum and Average Rate of Change of Gold versus Money Supply M2: 1868 to 2011
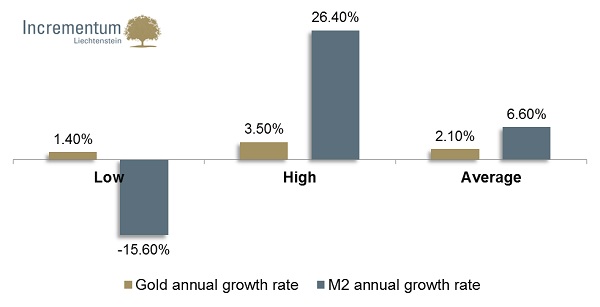
Source: GoldMoney Foundation, "The Aboveground Gold Stock: Its Importance and Its Size", James Turk
If one analyzes the rates of change in different periods of time, one also notices the relative scarcity, the higher stability and lower volatility of the stock of gold. Since 1914, the year in which the Federal Reserve began to operate, the growth of M2 was 6.9% on average, while the stock of gold has only grown at 2% per annum.
Average Rate of Change Gold versus Money Supply M2 in Different Time Periods
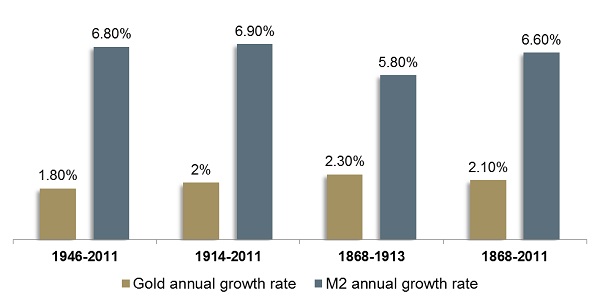
Source: GoldMoney Foundation, "The Aboveground Gold Stock: Its Importance and Its Size", James Turk
Despite technological progress and the associated increase in mine production, the stock of gold never grew by more than 3.5% in a year. This constant growth of the stock of gold results from the properties of natural deposits. Even if it takes ever more effort and becomes more expensive to mine gold, this is compensated by ever more efficient mining technology.
What does this actually mean? Let us assume that the price of gold rises considerably in the future and mining adjusts accordingly, then mining of e.g. 3,500 tons per year would certainly be possible within 10 years time. If we assume further that annual mine production grows by 3% p.a. over the next ten years, cumulative mine production would amount to about 31,000 tons over the period. The total stock of gold would then amount to approximately 203,000 tons by 2023. If mine production were to amount to 3,500 tons at that point in time, this would still only represent an annualized inflation of the stock of gold of 1.7%.
4. CONCLUSION
We are firmly convinced that the fundamental argument in favor of gold remains intact. There exists no back-test for the current era of finance. Never before have such enormous monetary policy experiments taken place on a global basis. If there was ever a time when monetary insurance was needed, it is today.
Gold is not only a store of value, but also a means of communication . At its most basic level, economic interaction is most often an exchange between strangers. Therefore, there has to be a certain degree of trust between strangers. Money is the means for exchanging this trust. Trust in financial markets is expressed in the form of yields. The less trustworthy a borrower, the higher the yield creditors will demand will be . However, if there are interventions, they increase the fragility of trust. Credit is after all 'suspicion asleep', which is also the reason why it is so difficult to forecast debt crises with precision. The precise point at which confidence collapses and creditors lose their trust in the creditworthiness of borrowers is impossible to forecast .
We believe gold should continue to be an integral part of investment portfolios. Gold is the only liquid investment asset that neither involves a liability nor a creditor relationship. It is the only international means of payment independent of governments, and has survived every war and national bankruptcy. Its monetary importance, which has established and manifested itself in the course of the past several centuries, is in the process of being rediscovered.
Contrary to 1979/1980, the current gold bull market will unlikely end due to a sudden strong rise in interest rates, as the balance sheets of governments, households and corporations are tainted by huge debt. In the current environment, this would lead to a deflationary depression. According to the BIS, the combined debt burden of governments, households and non-financial corporations in the 18 OECD core countries has risen from 160% of GDP in 1980 to 340% of GDP in 2012.
In order to counter the current problems in the financial sector, but also in the real economy, the Fed, the Bank of Japan, the Bank of England and the ECB are going to continue to hold interest rates at a low level. There has always been a strong link between negative real interest rates and the gold price.
We believe it is highly unlikely that the European crisis countries (Italy, Spain, Portugal) will sell their gold reserves. For one thing, such sales would lower their debt ratios only marginally, for another this would also be an admission of weakness and would only serve to shake already battered market confidence even more. It would moreover be technically difficult, as the central bank gold agreement that is in force until September 2014 limits sales by European central banks to 400 tons per year.
Gold Holdings of Euro Zone Countries Cover Less than 10% of Their Overall Debt
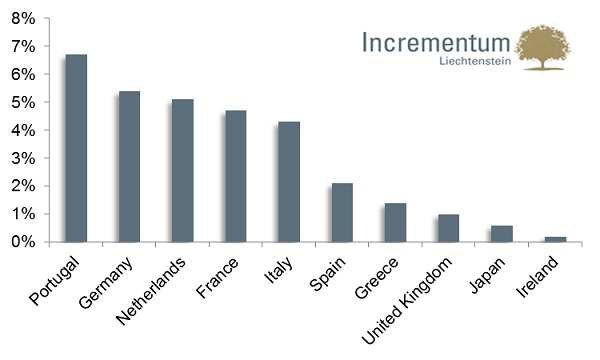
Source: UBS, WGC, Eurostat, Bloomberg, calculated per Q3 2012, resp. a gold price of $1,400 and EUR/USD 1.30
The gold mining industry currently goes through a major period of change. It appears as though the industry is in the process of altering its priorities. Profitability, disciplined capital deployment and stable cash flows per ounce of gold appear to be preferred over maximizing gold production. We believe that the new commitment to transparent cost reporting, greater financial discipline and shareholder value is a crucial – if quite late in coming – insight by the sector. From a sentiment perspective, gold mining stocks are probably “the ultimate contrarian play”
For the first time we have performed a quantitative evaluation of gold in this gold report. Our model incorporates a wide range of scenarios for US monetary policy. Even if tail events are taken into account with only minor probablitites, the model justifies a considerable risk premium. Based on our parameters, a gold price target of $2,230 has resulted.
From a technical perspective, we assume that the gold price is in a long term consolidation phase since its all-time high in August 2011, similar to the mid cycle correction of 1974-1976. Due to extremely negative sentiment, the clearly positive implications of the CoT data, and extremely oversold readings, we assume that a bottoming process will soon begin. From a seasonal perspective, only very little momentum should be expected before August.
Regarding the sentiment backdrop, we see anything but euphoria in gold. Skepticism, fear and panic are never observable at the end of a long term bull market. We therefore assume that our long term price target of $2,300 per ounce, already formulated several years ago, remains realistic.
In the course of the price collapse, massive technical damage has been inflicted. We are therefore strongly convinced that repairing the chart picture is going to take some time. We regard the $1,480 level as the next 12 month target.
THE COMPLETE VERSION OF THIS INSIGHTFUL AND PROVOCATIVE REPORT MAY BE FOUND AT http://www.incrementum.li/


